Using Snyk reporting for data-driven security
Daniel Berman

December 9, 2022
0 mins readEditor’s note: February 6th, 2023
Get a single view of your cloud environments’ compliance with Snyk Cloud’s new Cloud Compliance Issues report.
Last month, we announced the open beta of Snyk’s new and revamped reporting. Since then, we’ve been amazed at how creative our customers have been in leveraging these new capabilities to answer all sorts of different security questions.
We’re not surprised. The new reporting was designed to provide easy access to data across the Snyk platform (including Snyk Code!), and to give customers flexible analysis tools to slice and dice data as they see fit. The new capabilities include data filtering, sorting, and sharing options, built-in reports, and of course Snyk Code reporting data.
The word “data” is key here. Easy access to accurate data (and the ability to dive into it for research) has become a critical element for operating a business. Security data is no exception. Snyk’s security data holds the key to understanding, managing, and mitigating risk effectively — and our new reporting capabilities provide the tools to access and analyze it.
So: what can be done with Snyk’s data and reporting capabilities?
Prioritize
Prioritization is probably one of the most important use cases when it comes to leveraging Snyk’s data. While all organizations are looking to solve the same challenge — figuring out how to tackle endless issue backlogs with minimal resources — their strategies differ. The most common approach is to focus on high risk first, usually by producing reports on issues with a critical or high severity level assigned to them. But other risk management approaches look at different metrics, such as ROI or business impact.
The good news is that Snyk’s data supports many different strategies with the help of an extensive set of filters (with more filters being added continuously).
Targeting the low-hanging fruit
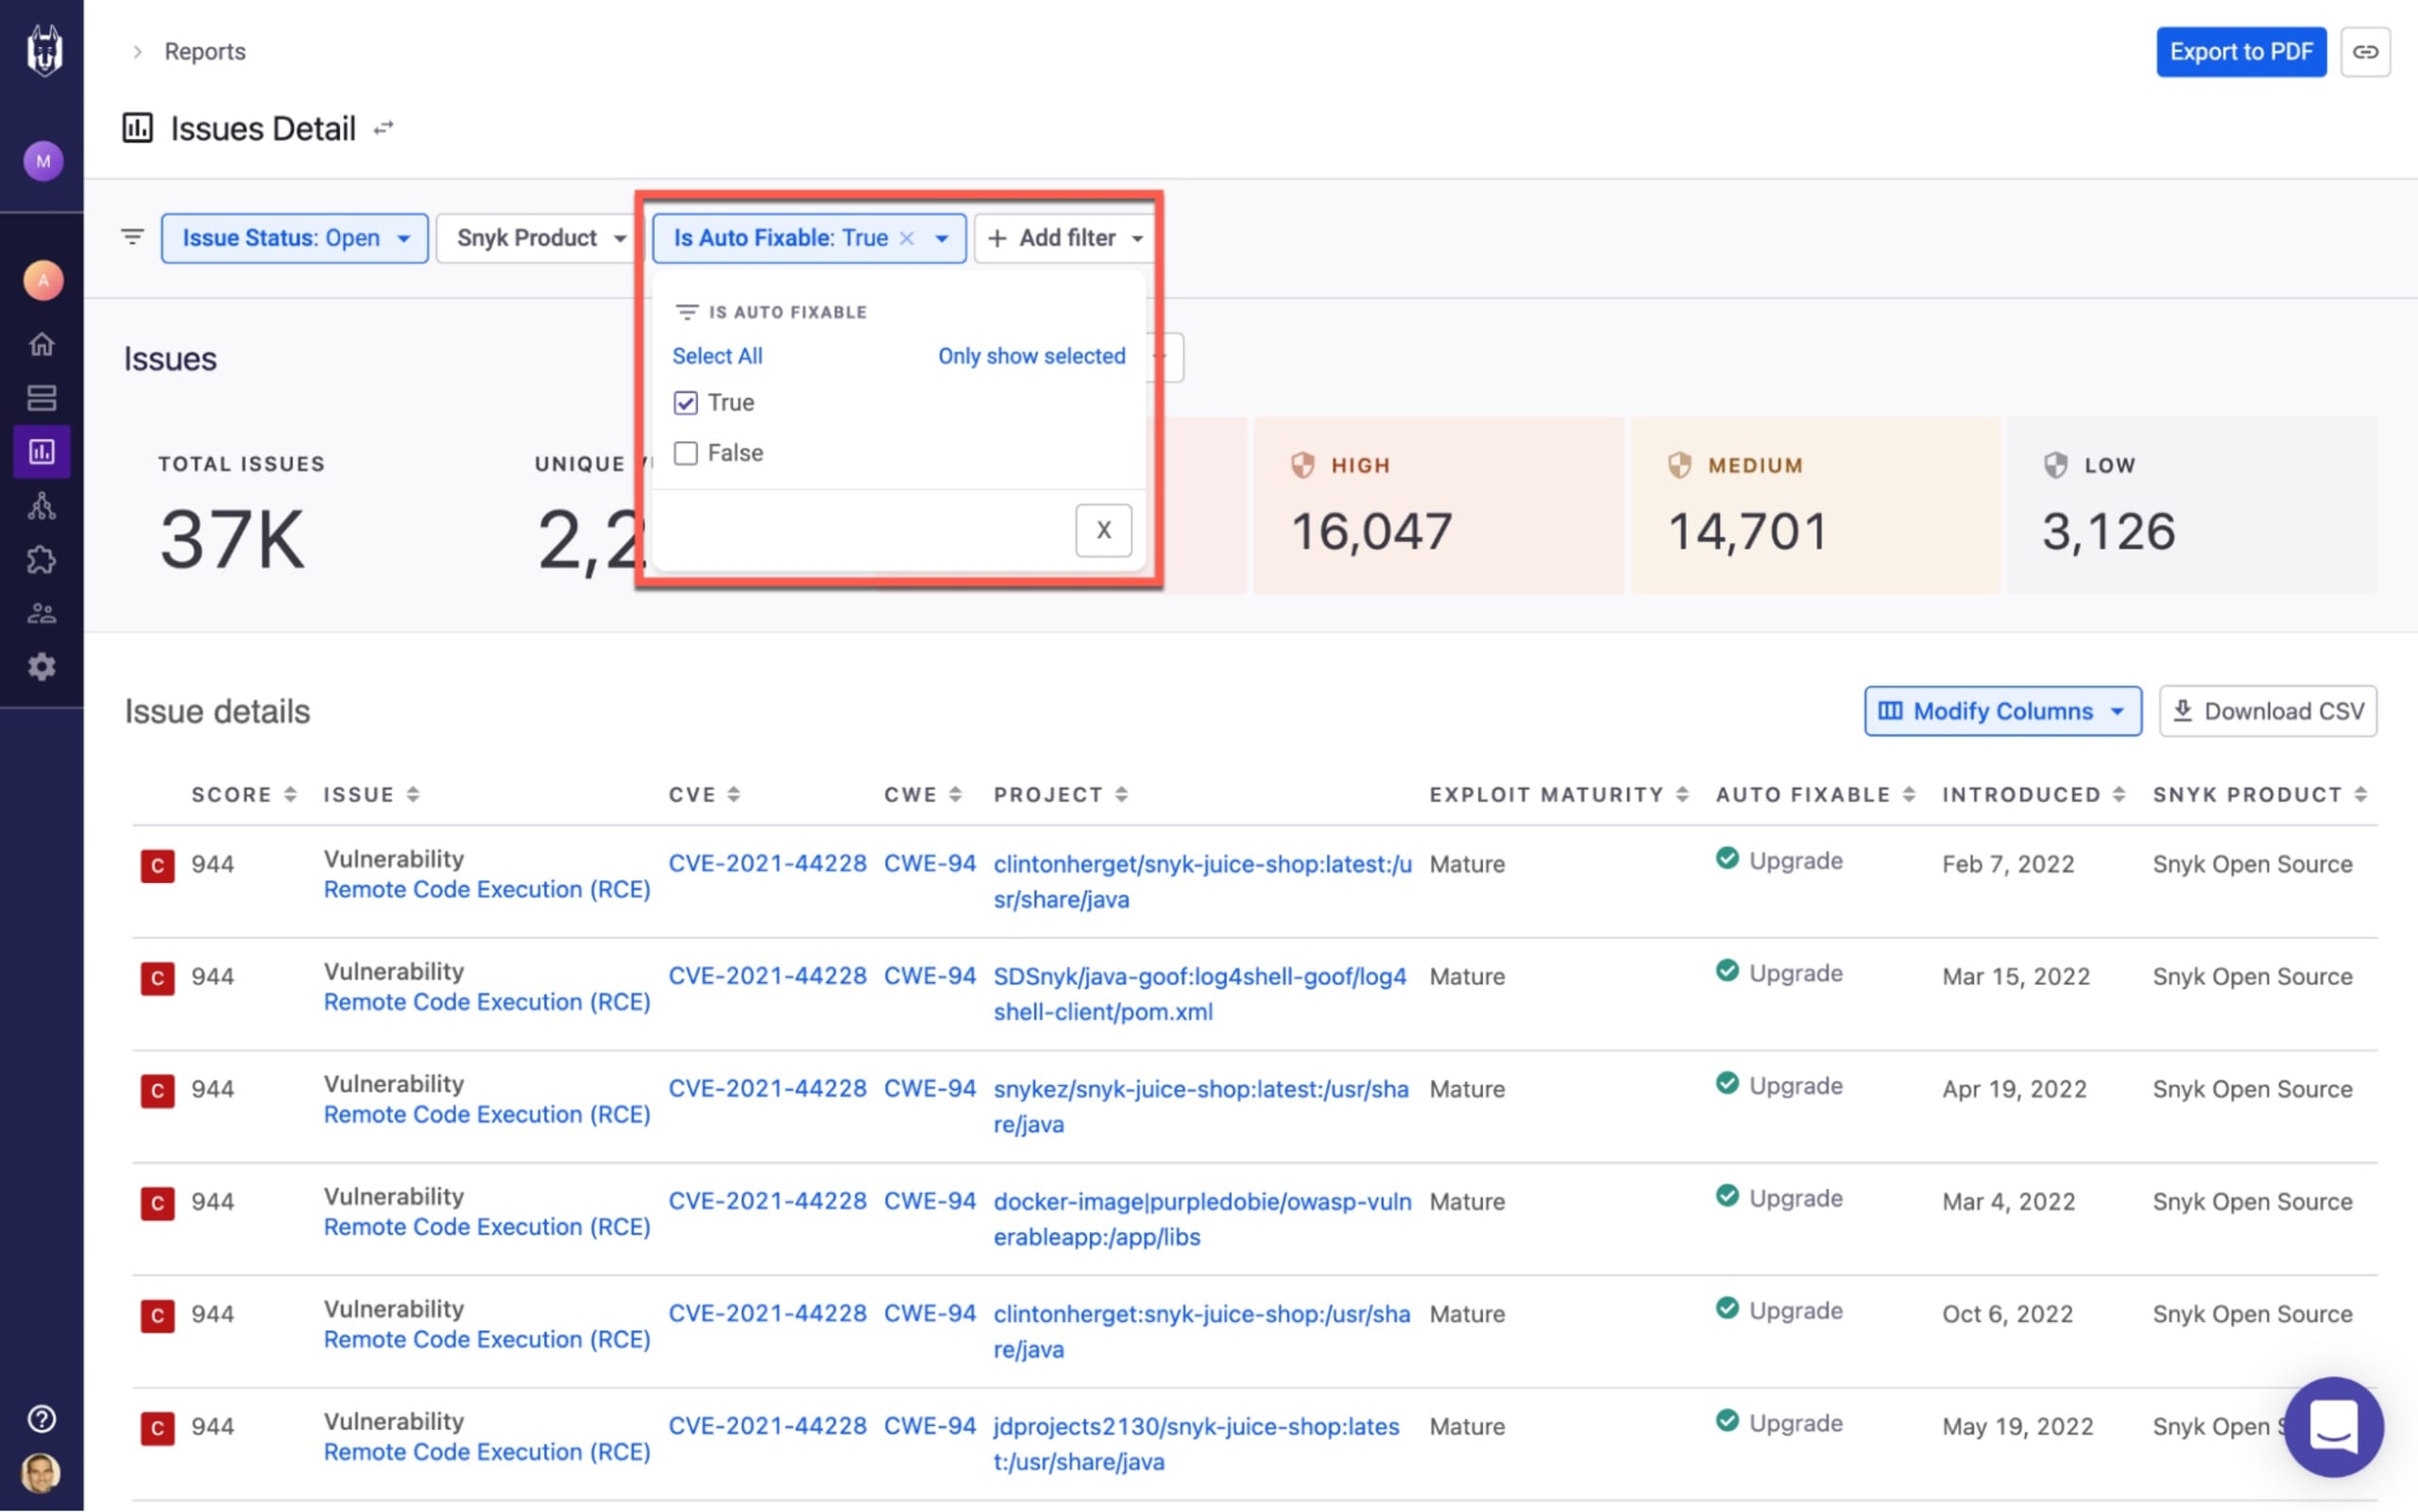
Some security teams are more result-focused than others, and try to find the quickest and simplest ways to reduce risk. Customers using Snyk can quickly filter Snyk’s Issues Detail report to identify critical severity vulnerabilities, and then generate an auto-fix PR to remediate those issues. That’s the way to focus on low-hanging fruit.
Maximizing business impact
Another common prioritization strategy is to focus efforts on the organization’s crown jewels — specific applications or projects that are critical for the business. For example, fixing a vulnerability in an internal, sandboxed application is probably less urgent than fixing one in a front-end, customer-facing application, right?
In Snyk’s Issues Detail report, you can filter issues using various project attributes and tags to report by project criticality, lifecycle stage, application or business unit.

Leveraging Snyk’s Priority Score
Snyk’s Priority Score combines key factors that indicate the urgency of a specific issue: CVSS score, severity level, availability of a fix, exploit maturity, whether the issue is trending, and reachability (for Java projects only). Filtering reports using Priority Score is useful if there’s no defined prioritization strategy in place, and you want to focus on high-risk issues.

Measure
Implementing a security program within an organization is a daunting task in and of itself. Keeping track of progress, and assessing whether you’re on the right track to success, is just as challenging.
Before you rush to analyze the performance of one team or another, understand what you’re measuring. It’s easy enough to extract a number, but how do you know whether a result is good or bad? Having a set of well defined KPIs and SLAs is your first step. When you have those metrics in place, you can start tracking and benchmarking.
A good practice for defining SLAs is to base them on realistic expectations. For example, define an SLA focused on resolving critical and high severity issues first. Evaluate the resources you have, and set a reasonable timeframe for resolution. Consult with the different teams involved in the process and use Snyk’s reporting to establish a baseline and back up your definitions.
Below are a few examples of key metrics that Snyk’s reporting can help you track, and details on using them to measure success.
Mean time to resolution (MTTR)
In vulnerability management, time is of the essence. The faster you can respond to a zero day vulnerability, the less your organization is exposed. Therefore one of the metrics considered as a KPI is mean time to resolution (MTTR), which represents the mean time between when an issue is first identified and when it is resolved.
As your security program matures, you may expect to see MTTR decreasing across the organization as a signal of improvement. But the precise value you aim for needs to be defined by what your organization has identified as acceptable risk.
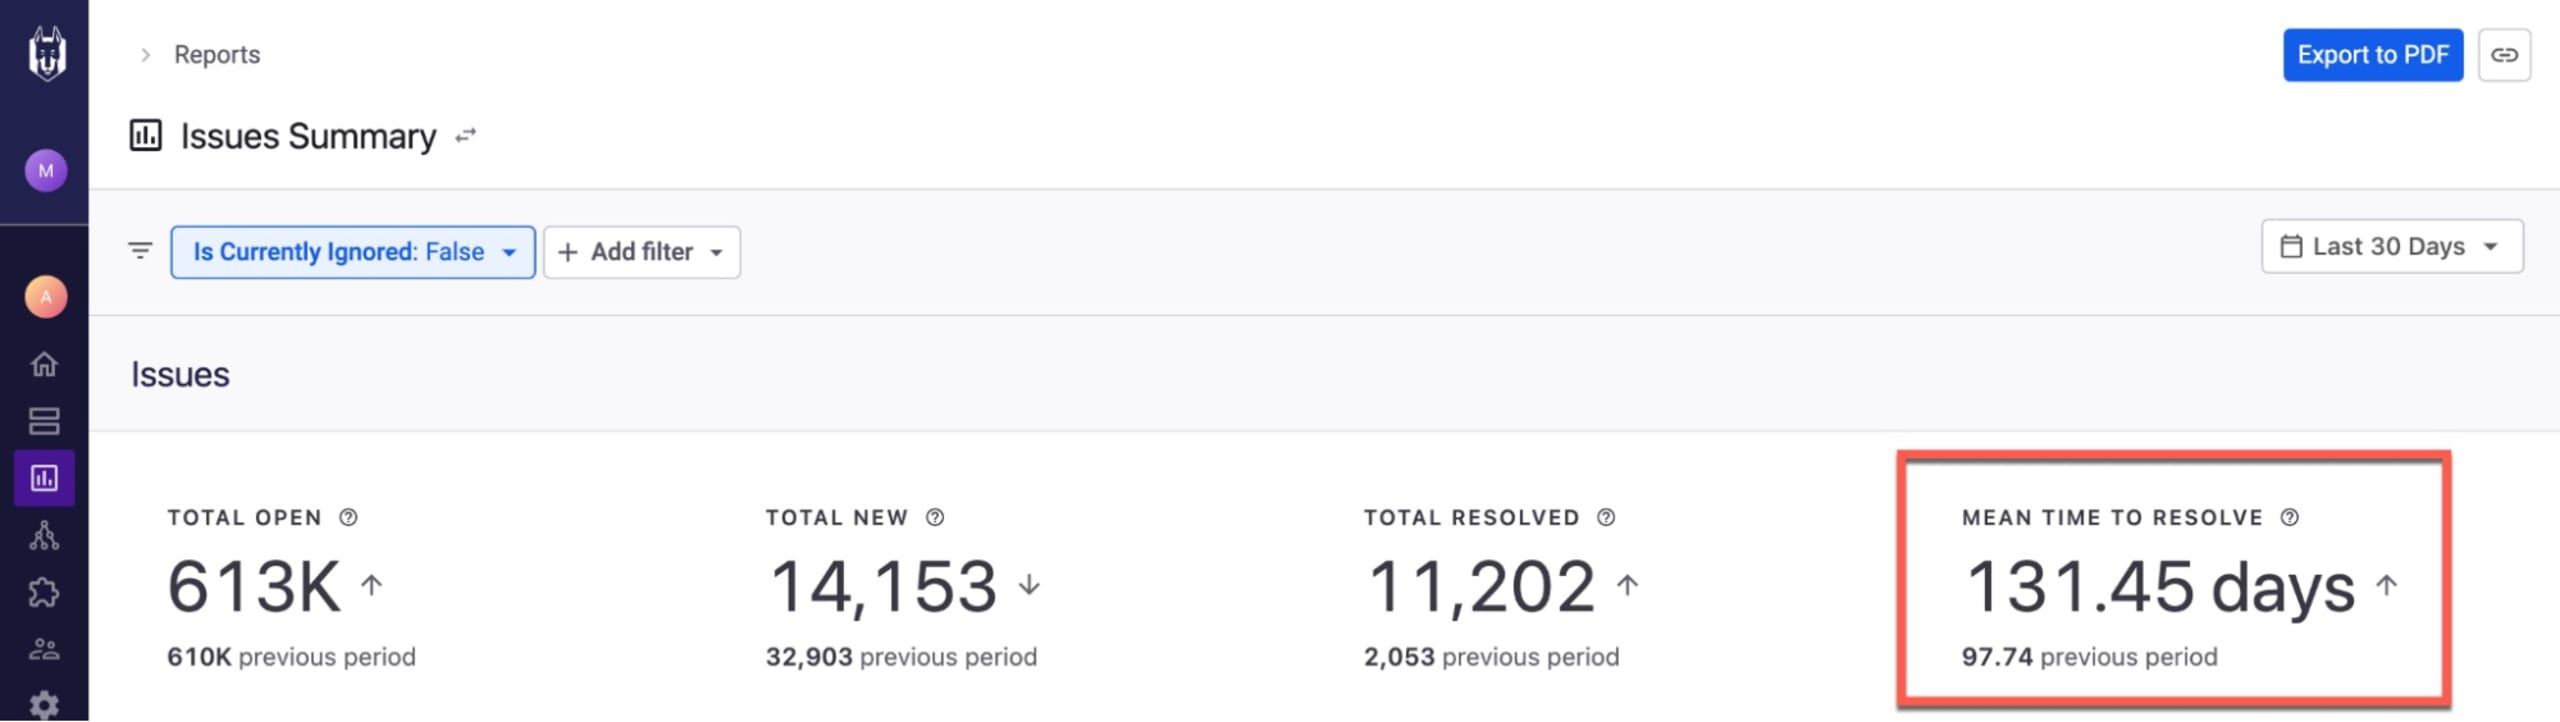
In Snyk’s Issues Summary report, you can track your MTTR and identify trends over time. For example, the Mean Time To Resolve metric at the top of the report enables you to easily compare with other date ranges selected in the time picker:
Open issues over time
Generally speaking, the number of issues identified by Snyk will likely always be on the rise. This is to be expected due to the nature of the business. As your organization grows, more projects and applications are scanned, so the cumulative number of the different types of issues also grows. Therefore you can expect to see spikes when initially onboarding with Snyk, or when scanning additional applications.
The number of issues resolved should also rise as your program matures and more development teams engage in remediation efforts.
The difference between these two data points at any given time represents the number of open issues that need to be improved (# of issues identified - # of issues remediated = # of open issues).
Using the Issues Identified and Resolved chart on Snyk’s Issues Summary report, you can ensure that this is indeed the trend you’re seeing in your organization.
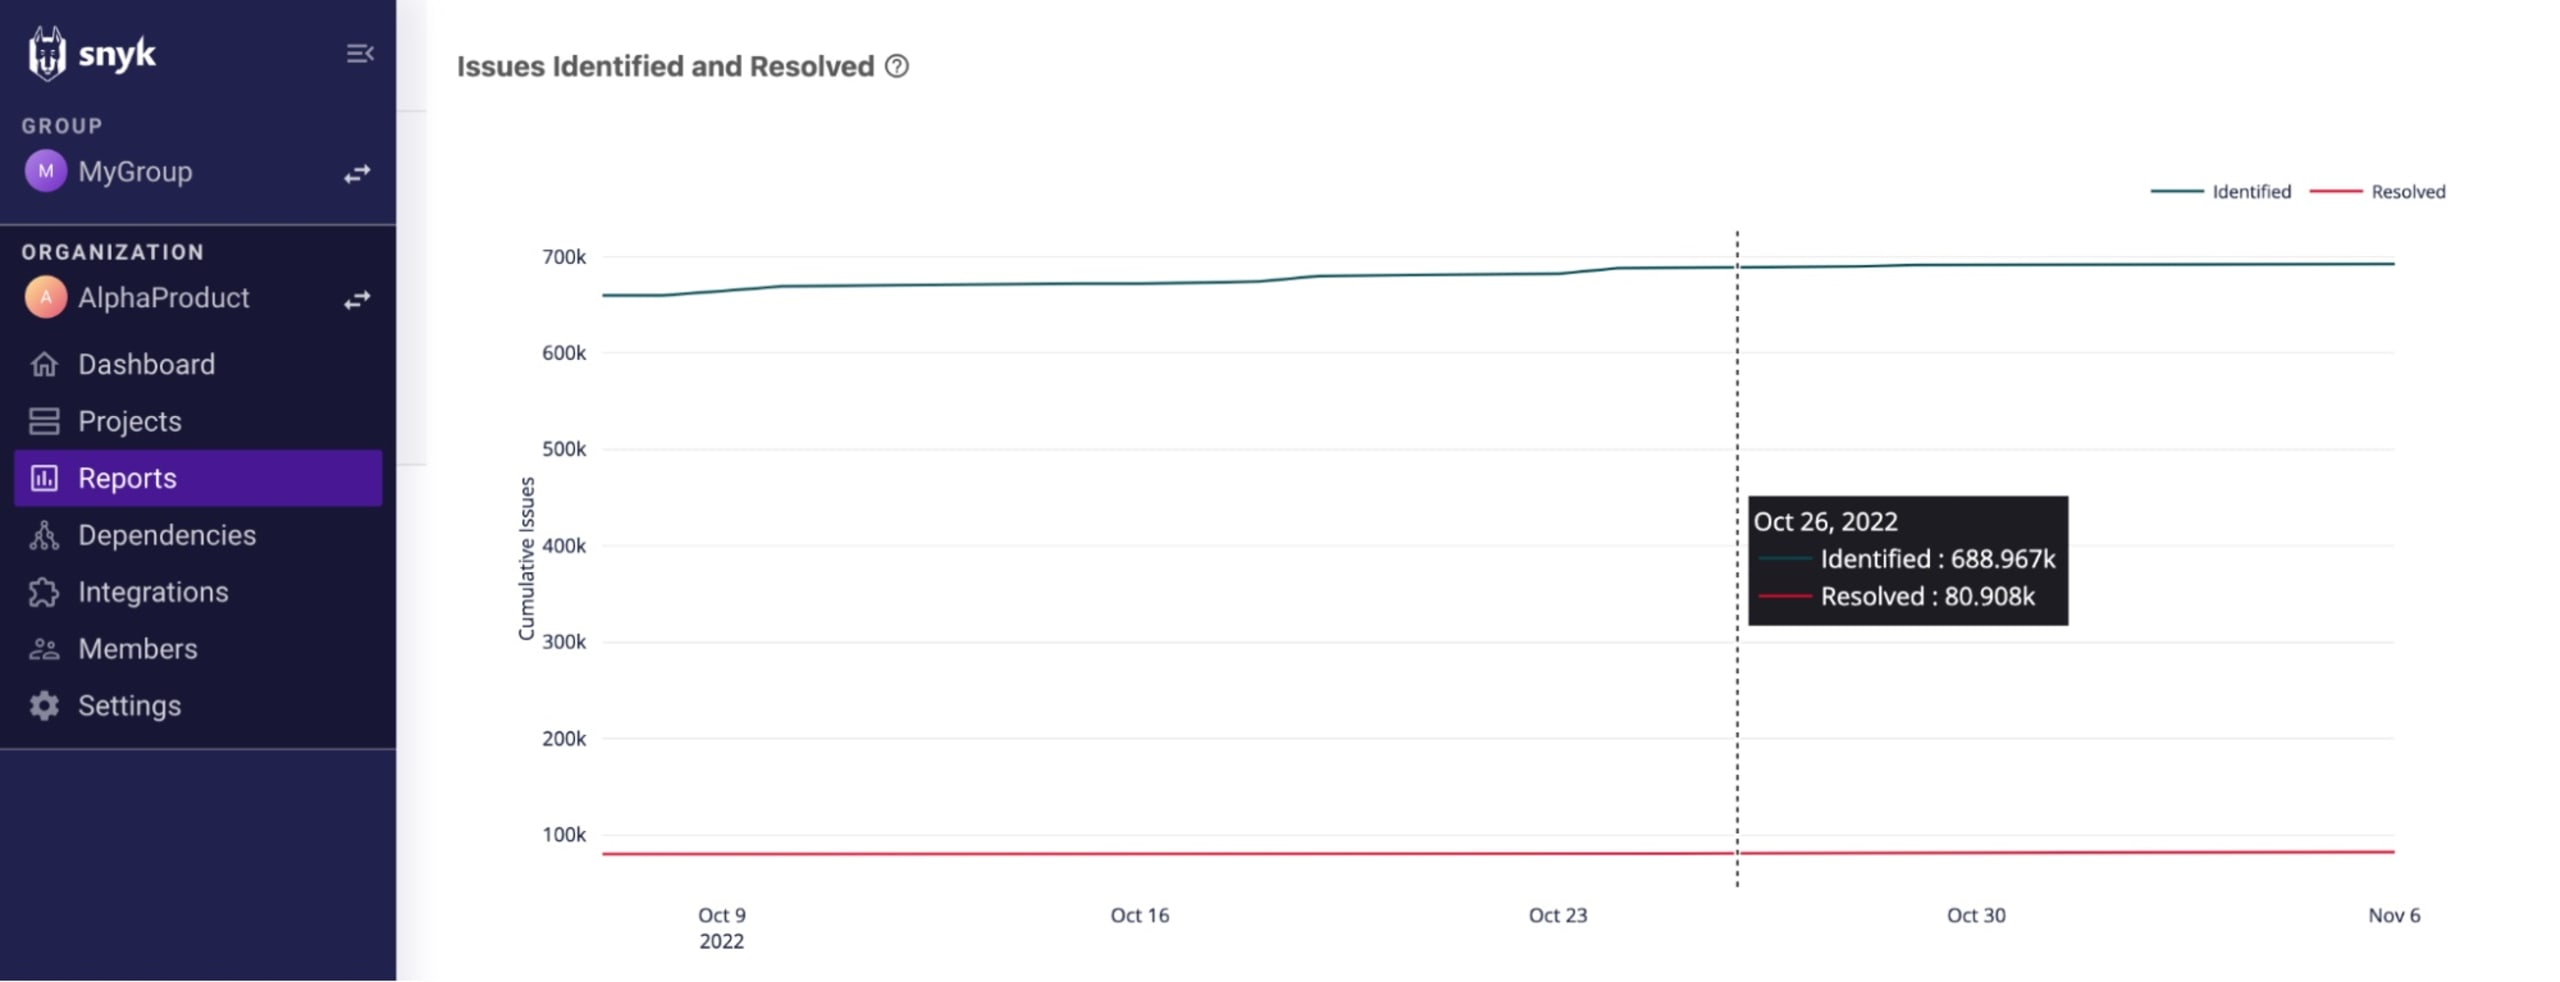
You can use the available filters to compare across different timeframes. During onboarding, for example, you can expect a bigger difference between the two data points than what you would see a few months after implementation. You can also compare between teams and projects using project tags and project attributes filters.
Exposure windows and time to resolve
Snyk’s reporting provides you with a number of metrics that can help you gauge your overall security posture over time and the progress of your security program.
First, you can track your exposure window for any given point in time.
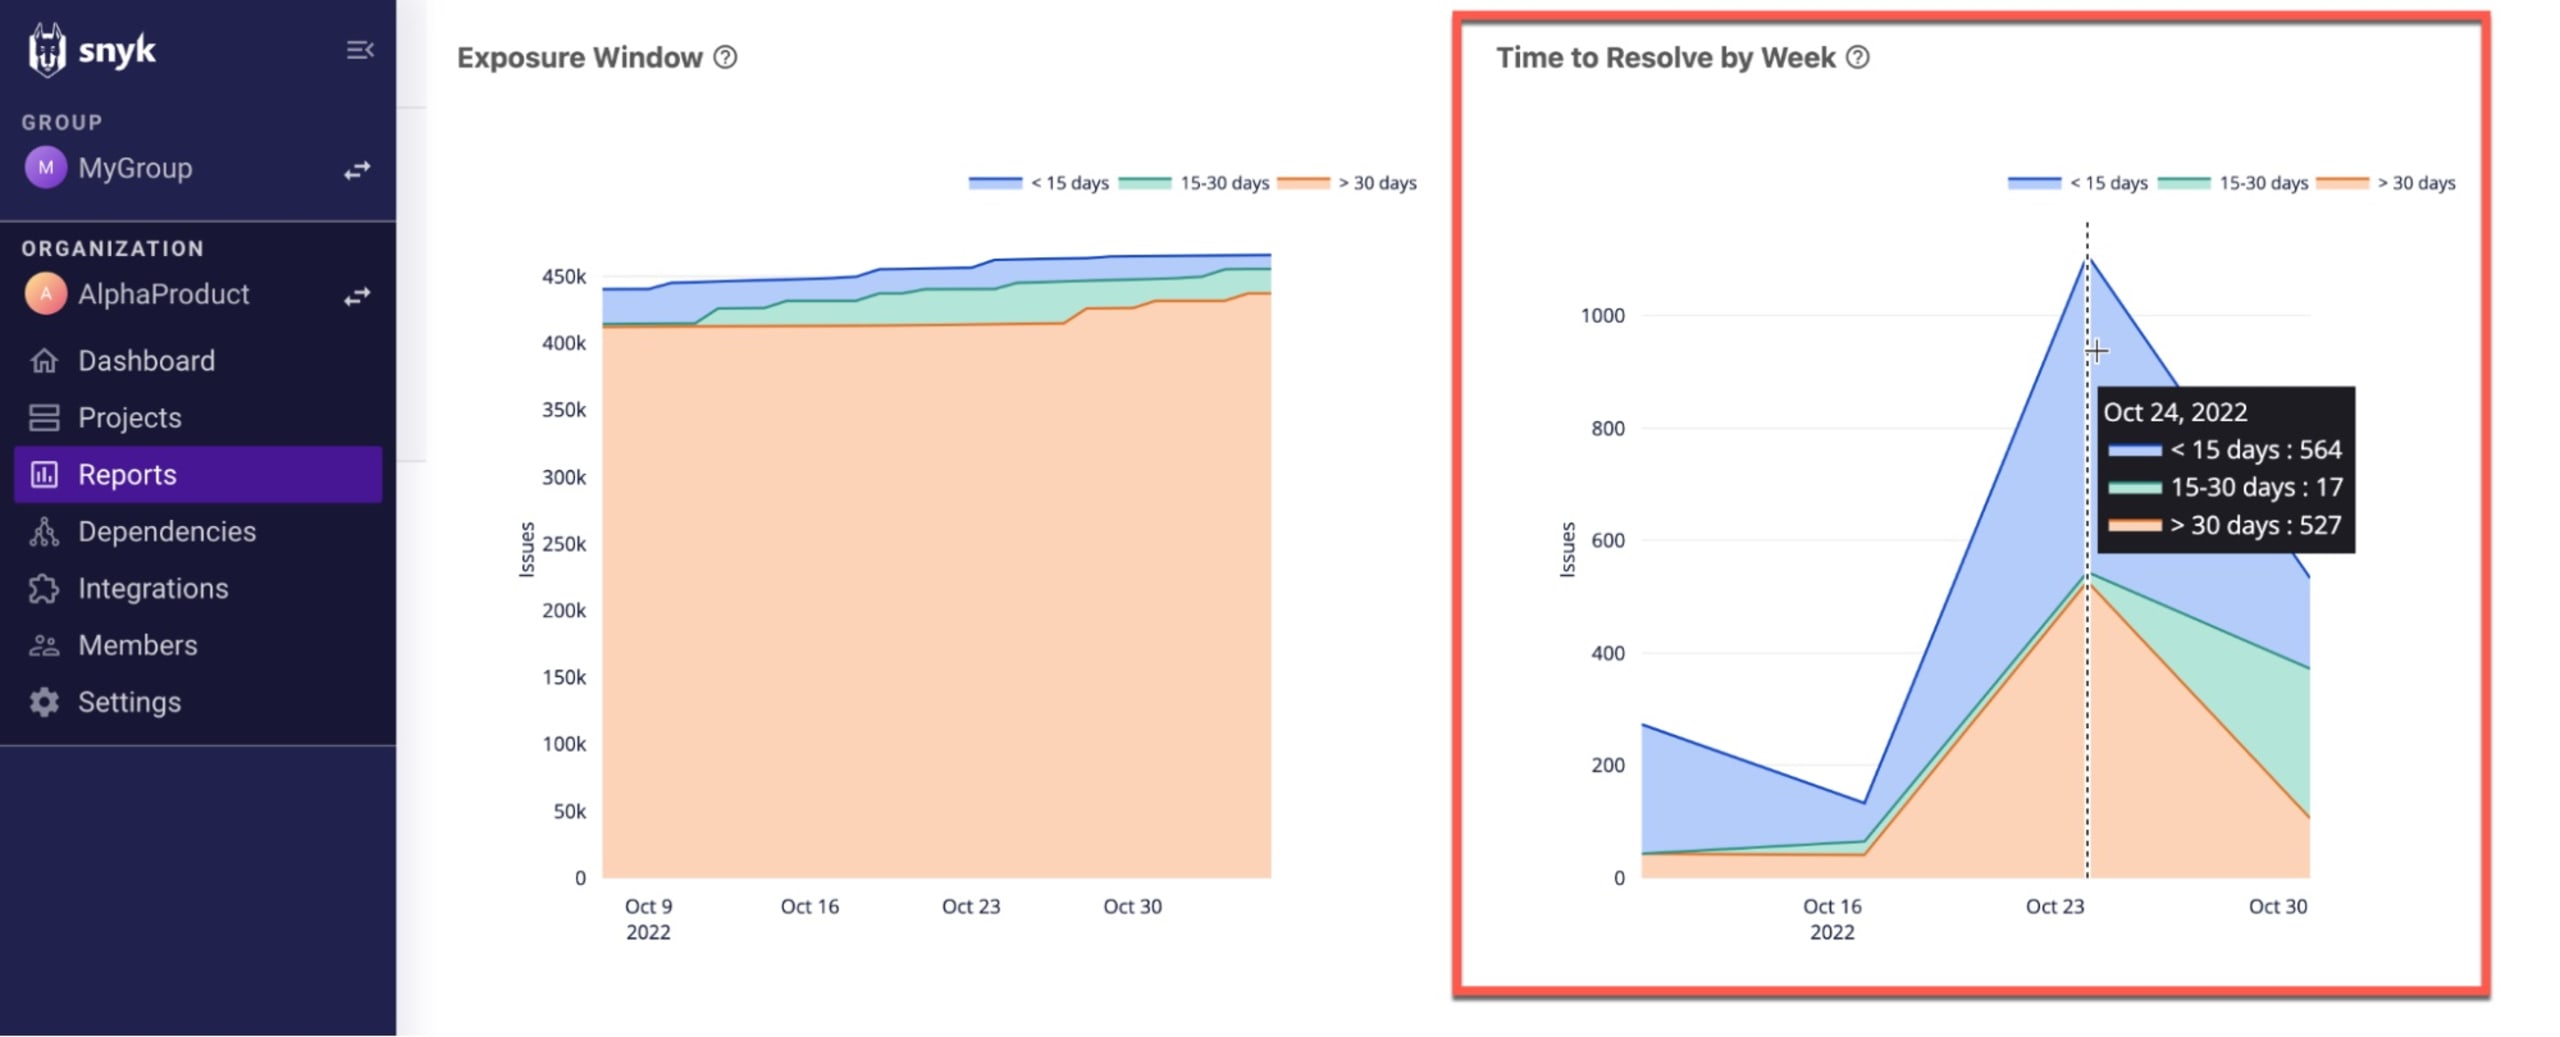
Snyk defines the exposure window as the time issues remain open, and calculates this metric in three age brackets: < 15 days, 15 - 30 days, and > 30 days. In the Exposure Window chart on Snyk’s Issues Summary report, you’ll want to see an increasing number of issues bucketed in the blue, the bracket for issues resolved in less than 15 days:
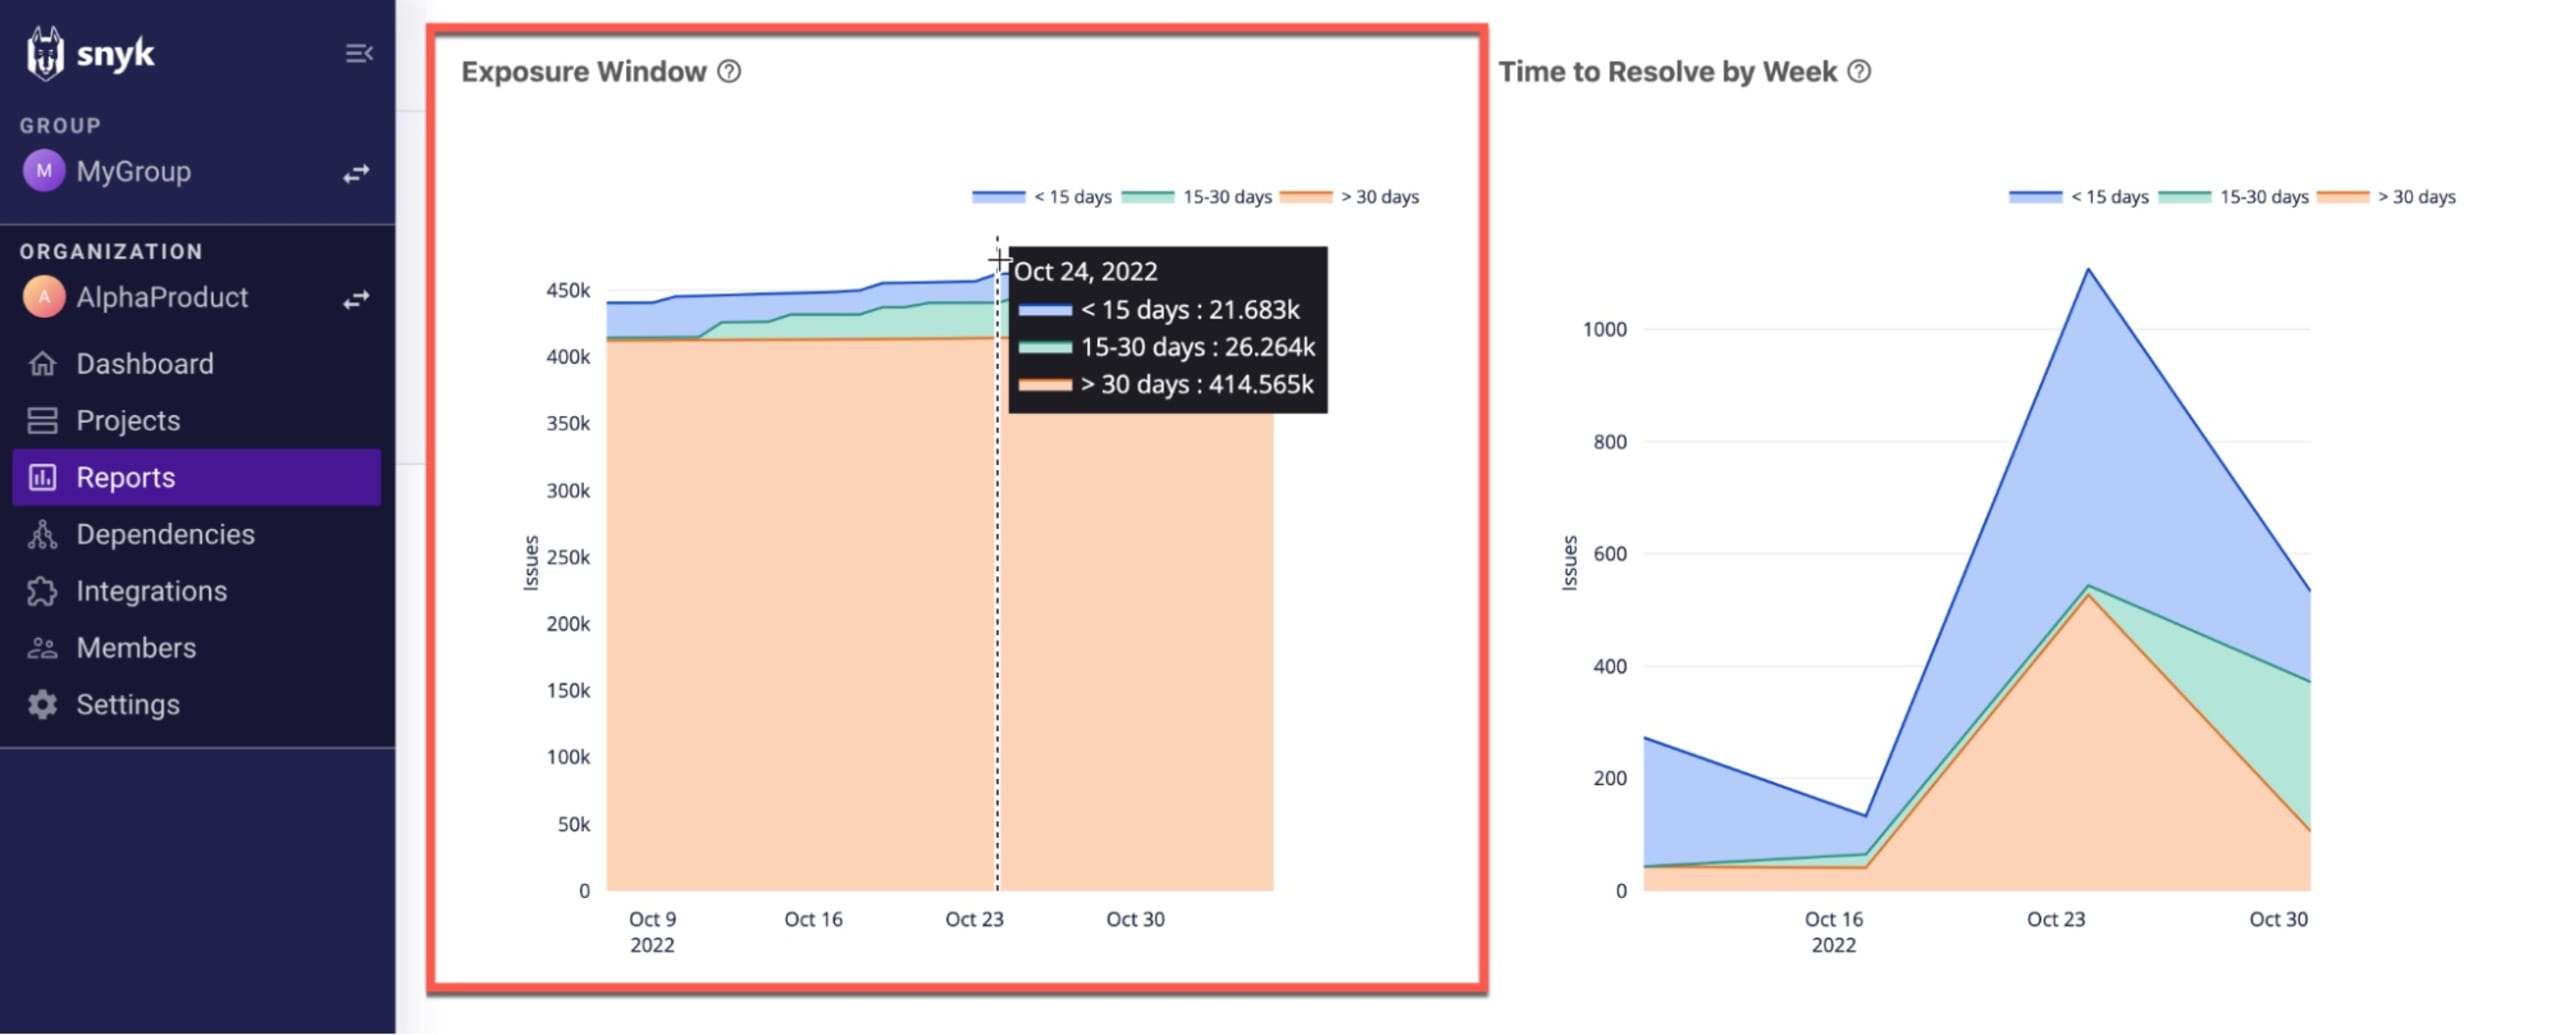
In the adjacent Time to Resolve by Week chart, you can take a more detailed, time-focused look at the performance of your teams. The graph shows the number of issues resolved per week using similar brackets: < 15 days, 15-30 days, and > 30 days. For the week selected in the example below, 564 issues were resolved in under 15 days, 17 took between 15 and 30 days to resolve, and 527 took over 30 days to resolve.
Demonstrate compliance
Attesting to the existence of a security risk assessment and vulnerability management program is a common requirement of organizations attempting to comply with regulatory or compliance standards such as PCI DSS and ISO 27001.
For example, the Health Insurance Portability and Accountability Act (HIPAA) states that:
[Covered entities must] conduct an accurate and thorough assessment of the potential risks and vulnerabilities to the confidentiality, integrity and availability of electronic protected health information held by the covered entity.
To this purpose, security reporting can help you share information about your current — as well as historical — risk exposure with your auditor, or demonstrate the security testing and vulnerability management program you have in place.
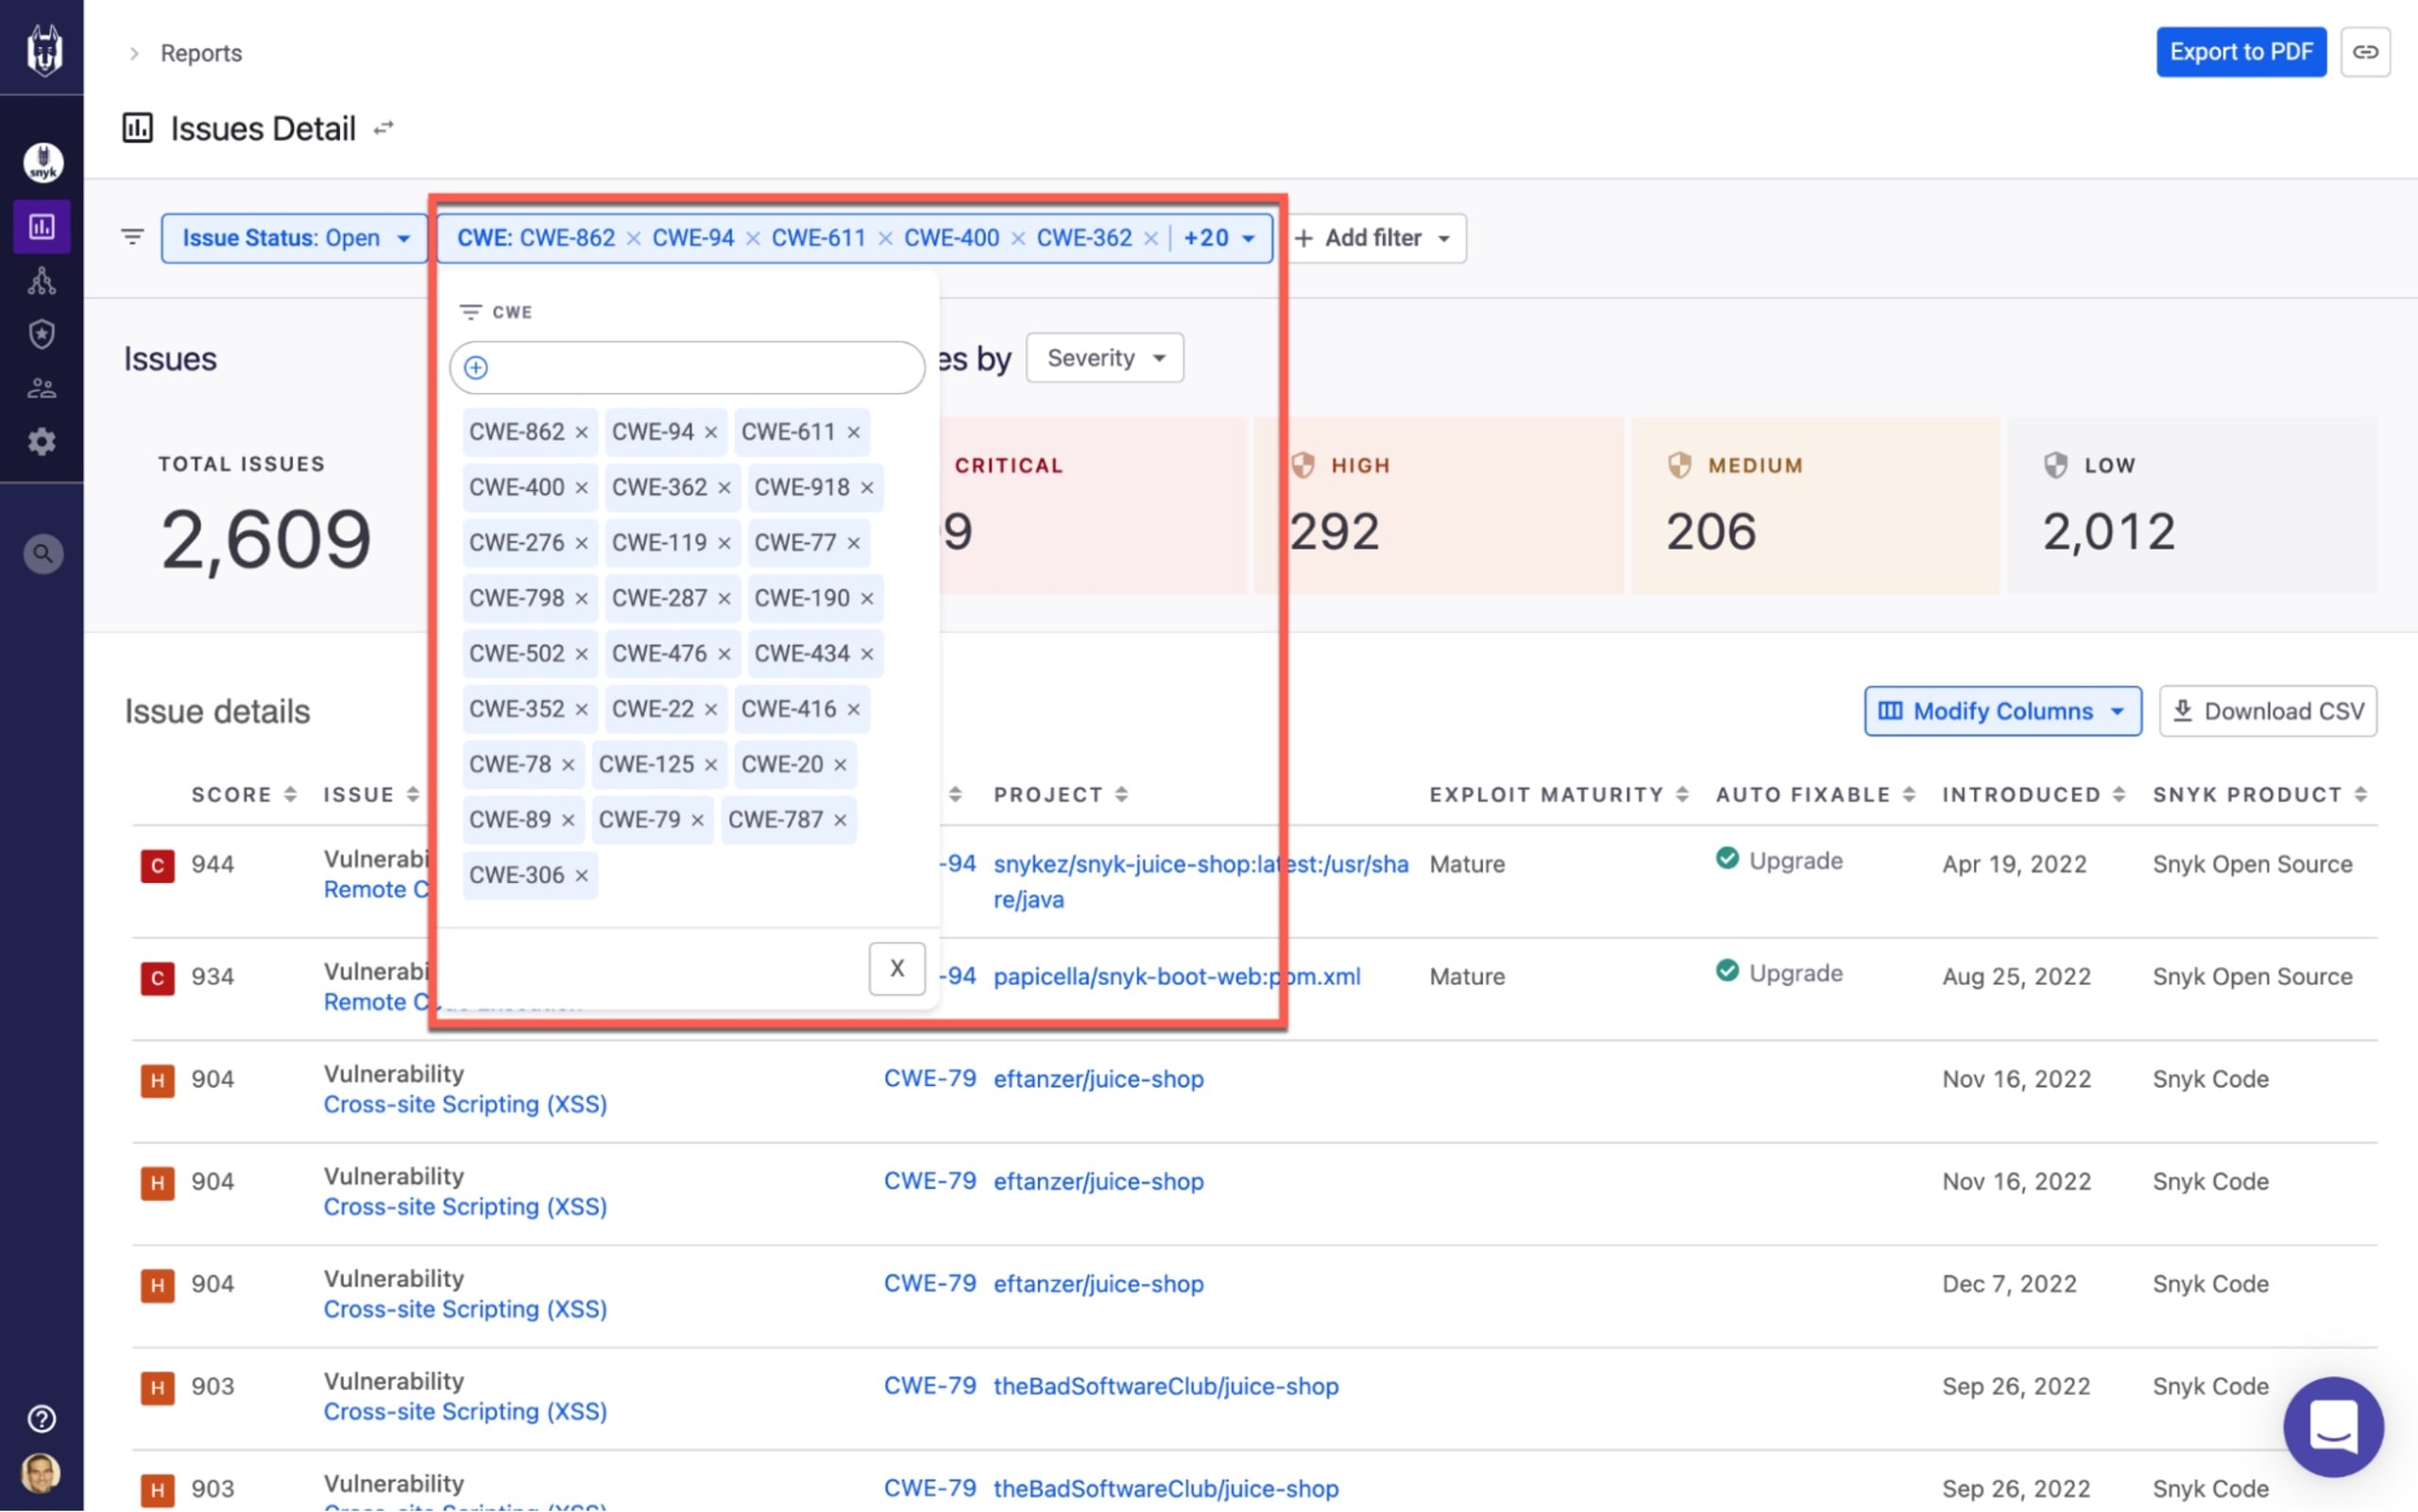
For example, using the new CWE and CVE filters on Snyk’s Issue Details report, you can demonstrate your compliance with frameworks that are often used as a reference guide by regulatory measures such as OWASP Top 10 or SANS Top 25:
Issues Details report filtered to match SANS Top 25
Export and share reports
Access to security data, and the ability to analyze it, increases your visibility into risk. But to leverage this data for better conversations within the organization, you need to be able to easily disseminate it.
What data you share, when you share it, and with whom, is totally up to you, of course. But here are a few examples of how our customers are sharing Snyk’s data:
Performance - often used by Application Security or Product Security teams, this data contains metrics per different development team or project, and is shared on a monthly basis.
Incident response - these reports are generated on an ad-hoc basis but on a set schedule thereafter, by Application Security or Product Security teams when tracking down zero-day vulnerabilities across projects.
Risk breakdown - typically used for reporting to development team leads either on a monthly or quarterly basis, this data focuses on the organizations or projects introducing the highest level of risk.
Security posture - this data is used for sharing high-level views with executives in the security team or other business stakeholders (for example, C-level executives and board members).
These are a few examples of ways to position Snyk’s security data for sharing with other parts of your organization. To take advantage of these views, you can use Snyk’s built-in reports (Issues Details, Vulnerability Details, Issues Summary) together with the advanced filtering options.
Let’s take a look at how Snyk helps you actually share the data.
URL sharing
Snyk’s reporting enables easy sharing of the same view across teams with persistent URLs. As you drill down into data using available filtering options, the filters exist as part of the URL, and can be copied and shared with other users in your Snyk account. A Copy URL button on the top-right corner makes this even simpler.
Exporting data
Snyk’s data can be exported into CSV or PDF files from various built-in reports. All you have to do is drill down to the data at the level of granularity you need, and click Export to PDF or Download CSV in the provided reports.

What’s next?
While prioritization, cross-team reporting, success monitoring, and compliance are the most common use cases, there are other ways to leverage Snyk’s security data. We’ll describe these in the future. In the meantime, here’s some general advice to help you make the most out of Snyk’s new reporting.
Training. Before you send off your first report to the board, familiarize yourself with Snyk’s reporting. Snyk makes it easy to explore on your own, but we also offer additional resources to help you and your team learn the ropes: Online documentation, Self-paced training.
Define goals. As mentioned, before you begin gauging your security posture and measuring progress, you should understand what you’re measuring against. This is not as straightforward as it sounds, so we recommend using frameworks like OWASP Top 10 or Snyk’s Top 10as a reference point.
Save your reports. Once you’ve landed on a view into Snyk’s security data that you find useful, save the view by bookmarking the URL for future reference. We’ll make saving reports easier in the future.
The capabilities described above are available in open beta for any Snyk customer who has either the Snyk Business or Snyk Enterprise plan. To start using these capabilities, simply enable them on the Snyk Preview page in the Snyk UI (click Settings, then Snyk Preview).The open beta follows a closed beta and a period of thorough testing, but if you encounter any issues, we’d love to get your feedback!