10 Dimensions of Python Static Analysis

July 17, 2024
0 mins readPython static analysis, also known as "linting", is a crucial aspect of software development. It involves inspecting your Python code without running it to identify potential bugs, programming errors, stylistic issues, or non-adhering patterns to predefined coding standards. It also helps identify vulnerabilities early in the development process, reducing the chances of deploying insecure code into production. For instance, it can spot insecure coding practices such as the use of hard-coded credentials, common mistakes that can lead to SQL injection attacks, or potential issues with data sanitization.
Python provides several libraries and tools for static analysis, such as Pylint, Pyflakes, and Flake8. For example, Pylint can help enforce coding standards, detect errors, and examine code complexity. Here's a simple code snippet showing how to use Pylint:
Running Pylint on it would give:
Pylint detected an error when we tried to add an integer and a string, which is not a valid operation in Python.
1. Type checking in Python static analysis
Python is a versatile, dynamic language, and its flexibility is one of the reasons it's a favorite among developers. However, this dynamism can sometimes lead to hard-to-find bugs, especially when it comes to type errors. This is where Python static analysis comes into play.
Before we dive into type checking, let's understand what dynamic typing means in Python. Python is dynamically typed, meaning that the type of a variable is checked at runtime, and you don't need to specify it explicitly. This is demonstrated in the code snippet below:
While dynamic typing can make Python easier to use and readable, it can also lead to type errors that are only discovered when the code is actually run.
The role of static type checking
Static type checking is an approach where type errors are caught early in the development process, i.e., during coding or building rather than at runtime. This can prevent potential bugs from making their way into production code, thus enhancing code security and reliability. Some examples of statically typed programming languages are Java and C++.
Python, although a dynamically typed language, also supports optional static typing through type annotations. This feature allows you to annotate the expected types of variables, function parameters, and return values. The Python runtime does not enforce these types, but they can be used by static analysis tools to catch potential type errors.
In this example, name is expected to be a string, and the function is also expected to return a string.
Tools for static type checking in Python
Several tools can help with static type checking in Python. Among these, Mypy, Pyright, and Pyre stand out for their robustness and wide acceptance in the Python community.
Mypy: An optional static type checker for Python that aims to combine the benefits of dynamic typing and static typing. It's versatile and can be used in a CI/CD pipeline to catch type errors before they make their way to production.
Pyright: Developed by Microsoft, Pyright is a static type checker that focuses on performance. It's written in TypeScript and runs on Node.js.
Pyre: Pyre is a performant type-checker for Python developed by Facebook. It's designed to help improve code quality and development speed by flagging type errors interactively in your terminal or your favorite editor.
Code example: Using Mypy for type-checking
Installing Mypy is as simple as running pip install mypy. Once installed, you can use it to check your Python files for type errors. Here's a simple example:
You can check this file using Mypy as follows:
As you can see, Mypy has caught the type error before the code is run.
2. Linters in Python static analysis
Linters are static code analysis tools that are used to flag programming errors, bugs, stylistic errors, and suspicious constructs. In the context of Python, linters play a crucial role in maintaining the quality and security of your code. They help to enforce coding standards, detect potential bugs and security vulnerabilities early in the development process, and improve the overall readability and maintainability of your Python code.
In the Python ecosystem, some of the most widely used linters are Pylint, Flake8, and Pyflakes.
Pylint: Pylint is a highly configurable, open-source tool that checks for errors in Python code, enforces a coding standard, and looks for code smells. Pylint can also be used to write custom plugins for specific use cases.
Flake8: Flake8 is a Python library that wraps PyFlakes, pycodestyle, and Ned Batchelder’s McCabe script. It is a great toolkit that checks your project for compliance with PEP 8, Python’s style guide.
Pyflakes: Pyflakes checks Python source files for errors quickly but without executing them. It's faster than Pylint and Flake8 because it doesn't enforce style guides, making it a good option for a quick, basic check of your Python code.
The concept of code smells and enforcing coding standards
Code smells are indicators of deeper problems with your code. They are patterns in code that suggest violations of fundamental design principles and negatively impact design quality. Some common examples of code smells in Python include large classes, long method, duplicate code, and dead code.
Linters like Pylint, Flake8, and Pyflakes help detect such code smells and enforce coding standards in your Python code to improve code quality and keep it at an acceptable standard. They do this by checking your code against pre-defined rules and guidelines, which are often based on community-adopted best practices such as PEP 8 for Python.
Code example demonstrating a linter in action
Here's an example of how to use Pylint to perform static analysis on a Python file named example.py:
To run Pylint on this file, you would use the following command:
If there are any issues with your code, Pylint will flag them and provide a detailed report. For example, it might highlight that the function add is missing function docstring, which is a violation of PEP 8's guidelines for writing good Python code.
Custom rules in linters
Linters like Pylint allow you to define custom rules for your Python projects. This is particularly useful when you have specific coding standards or guidelines that are unique to your project or organization.
Creating a custom rule in Pylint involves creating a Python class that extends from one of Pylint’s checker classes and then defining methods that perform the actual checking of the code. Once you've defined your custom rules, you can then add them to your Pylint checker using the register_checker method.
Here's a simple example of a custom Pylint rule that checks for the use of the print statement:
In this example, the NoPrintStatementsChecker class checks for the use of the print statement and raises a warning if it finds one. The register function is then used to register this custom checker with Pylint.
3. Security vulnerability detection
One of the critical dimensions of Python static analysis is security vulnerability detection. Let's break down the importance of security in Python static analysis, common security risks in Python code, and a few tools you can use for security vulnerability detection, such as Bandit and Snyk Code.
When you write Python code, security should not be an afterthought but an integral part of the development process. Python static analysis plays a crucial role in ensuring code security, as it can help identify potential security vulnerabilities at an early stage of the development cycle, even before the code execution. Vulnerabilities such as injection attacks, insecure direct object references, security misconfigurations, and cross-site scripting are prevalent in Python code.
For instance, an SQL injection vulnerability in Python code might look like this:
In the above example, the user_id is directly used in a SQL query, which opens up the possibility for SQL injection if the user_id is not properly sanitized and is provided by the user.
Tools for security vulnerability detection
Bandit
Bandit is a tool designed to find common security issues in Python code. It processes each file, builds an AST (Abstract Syntax Tree) from the Python code, and runs appropriate plugins against the AST nodes.
Here's how you can use Bandit to scan your Python code for security vulnerabilities:
Would Bandit find an insecure direct object reference in Python? Unsure? read more about Snyk next.
Snyk Code
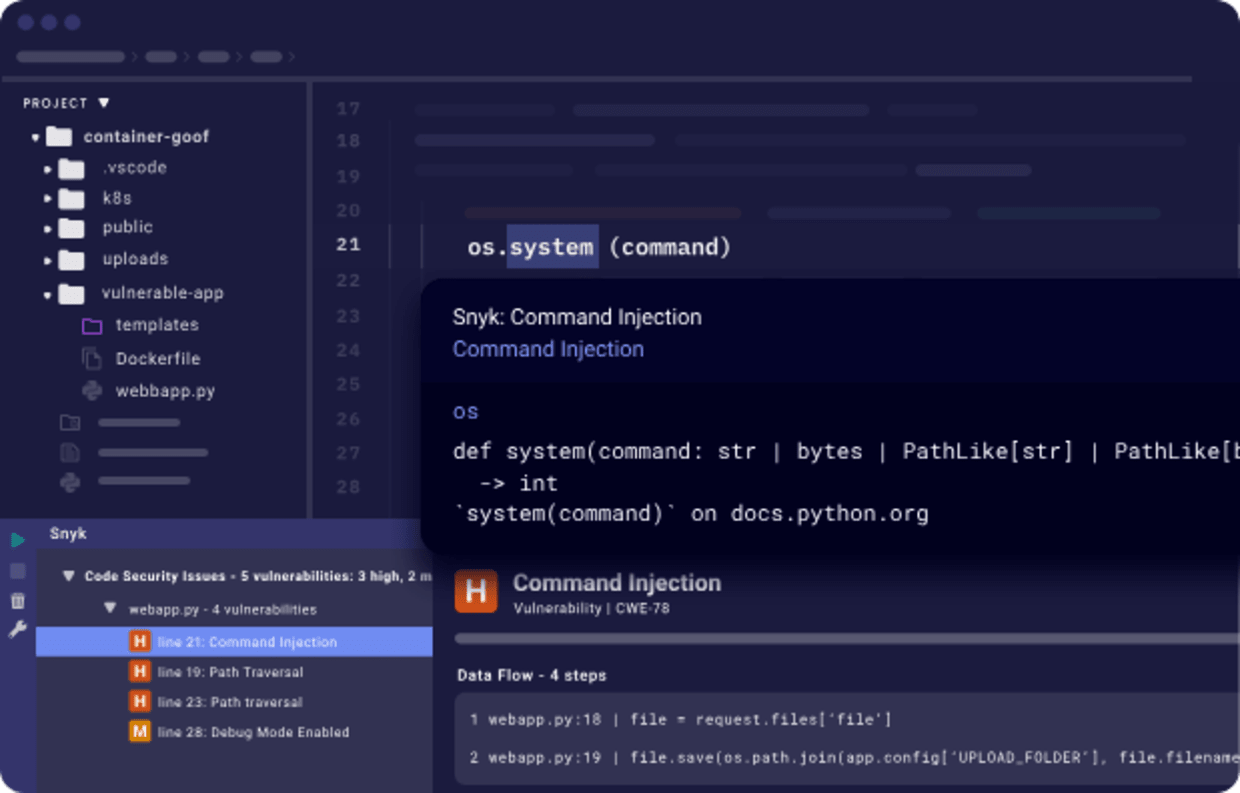
Snyk Code is another tool that provides a fast, symbolic AI-powered analysis engine. With Snyk Code, you can quickly find security vulnerabilities in your Python code. Snyk Code's static analysis engine is designed to understand the context and flow of your code, enabling it to detect complex security vulnerabilities that other tools might miss.
Snyk Code also comes with a PyCharm IDE plugin, allowing developers to detect and fix security issues in real time as they code.
To get started with Snyk Code, you simply need to download the PyCharm IDE plugin for Snyk, and you can start using it for free.
Implementing security vulnerability detection as part of your Python static analysis is crucial in ensuring the security of your software. Tools like Bandit and Snyk Code provide developers with an easy and efficient way to detect and fix security vulnerabilities in their Python code.
4. Code complexity analysis
Code complexity is a metric that is used to gauge how hard your code is to understand or modify. Higher complexity often translates to increased difficulty in comprehending the code, which in turn affects the code's maintainability.
Maintaining code is a regular part of a developer's job, but when the codebase becomes complex, it becomes increasingly challenging to understand and modify. This issue can lead to bugs and decrease the overall quality of the software. As a result, code complexity analysis is crucial in software development to ensure high-quality, maintainable code.
Cyclomatic complexity measurement with radon
To measure code complexity in Python, one can use various tools, and one of such is Radon. Radon is a Python tool that computes various metrics from the information extracted from the Abstract Syntax Tree (AST). One of these metrics is the Cyclomatic Complexity.
Cyclomatic Complexity is a software metric used to indicate the complexity of a program. It is a quantitative measure of the number of linearly independent paths through a program's source code. Radon analyzes your Python code and gives it a rank from A to F, where A means the code is simple and easy to understand, while F signifies it's too complex.
To use Radon, you need to install it first. You can install it using pip:
Code example demonstrating code complexity analysis
After installing Radon, you can use it to analyze your Python code. Let's consider the following Python code:
To measure the complexity of the above code, you would run the following command:
This command will return the cyclomatic complexity of the code. The complexity of the above code is 2, which means it is not very complex.
But if we look at a more complex function, for example:
Running Radon on this code would return a complexity of 5, indicating a higher level of complexity.
Using cyclomatic complexity tools helps maintain the quality of the code, making it easier to understand and modify. Tools like Radon provide a simple way to measure code complexity in Python, thus making your code more maintainable and less prone to bugs.
5. Dependency analysis
In the world of open source software taking a pillar step in software development, dependency analysis is a significant aspect that developers cannot afford to overlook. This procedure is crucial when dealing with large codebases in languages such as Python. Dependency analysis involves the identification of dependencies between different elements in a software project. Let's explore the importance of understanding and managing dependencies, tools for dependency analysis like Snyk and the Snyk Advisor, and a practical example showcasing dependency analysis in action.
Importance of understanding and managing dependencies
In Python projects, dependencies are the external packages or libraries that your project uses. These could range from web frameworks like Django or Flask to data science libraries like NumPy or pandas.
Understanding and managing dependencies is crucial for several reasons:
It helps maintain the stability and reliability of your software. If a dependency that your project relies on has a bug or breaks, your software could also break.
It assists in improving the security of your project. Dependencies can have security vulnerabilities that could affect your project if left unpatched.
It aids in aligning with licensing requirements. Each dependency may have its own license, and you need to ensure you comply with all of them.
Snyk Advisor for dependency analysis
Snyk Advisor is a tool that provides insights into your Python project's dependencies, including information about security vulnerabilities, licensing issues, and outdated packages. It helps you understand the risks associated with your dependencies and provides actionable advice on how to mitigate them.
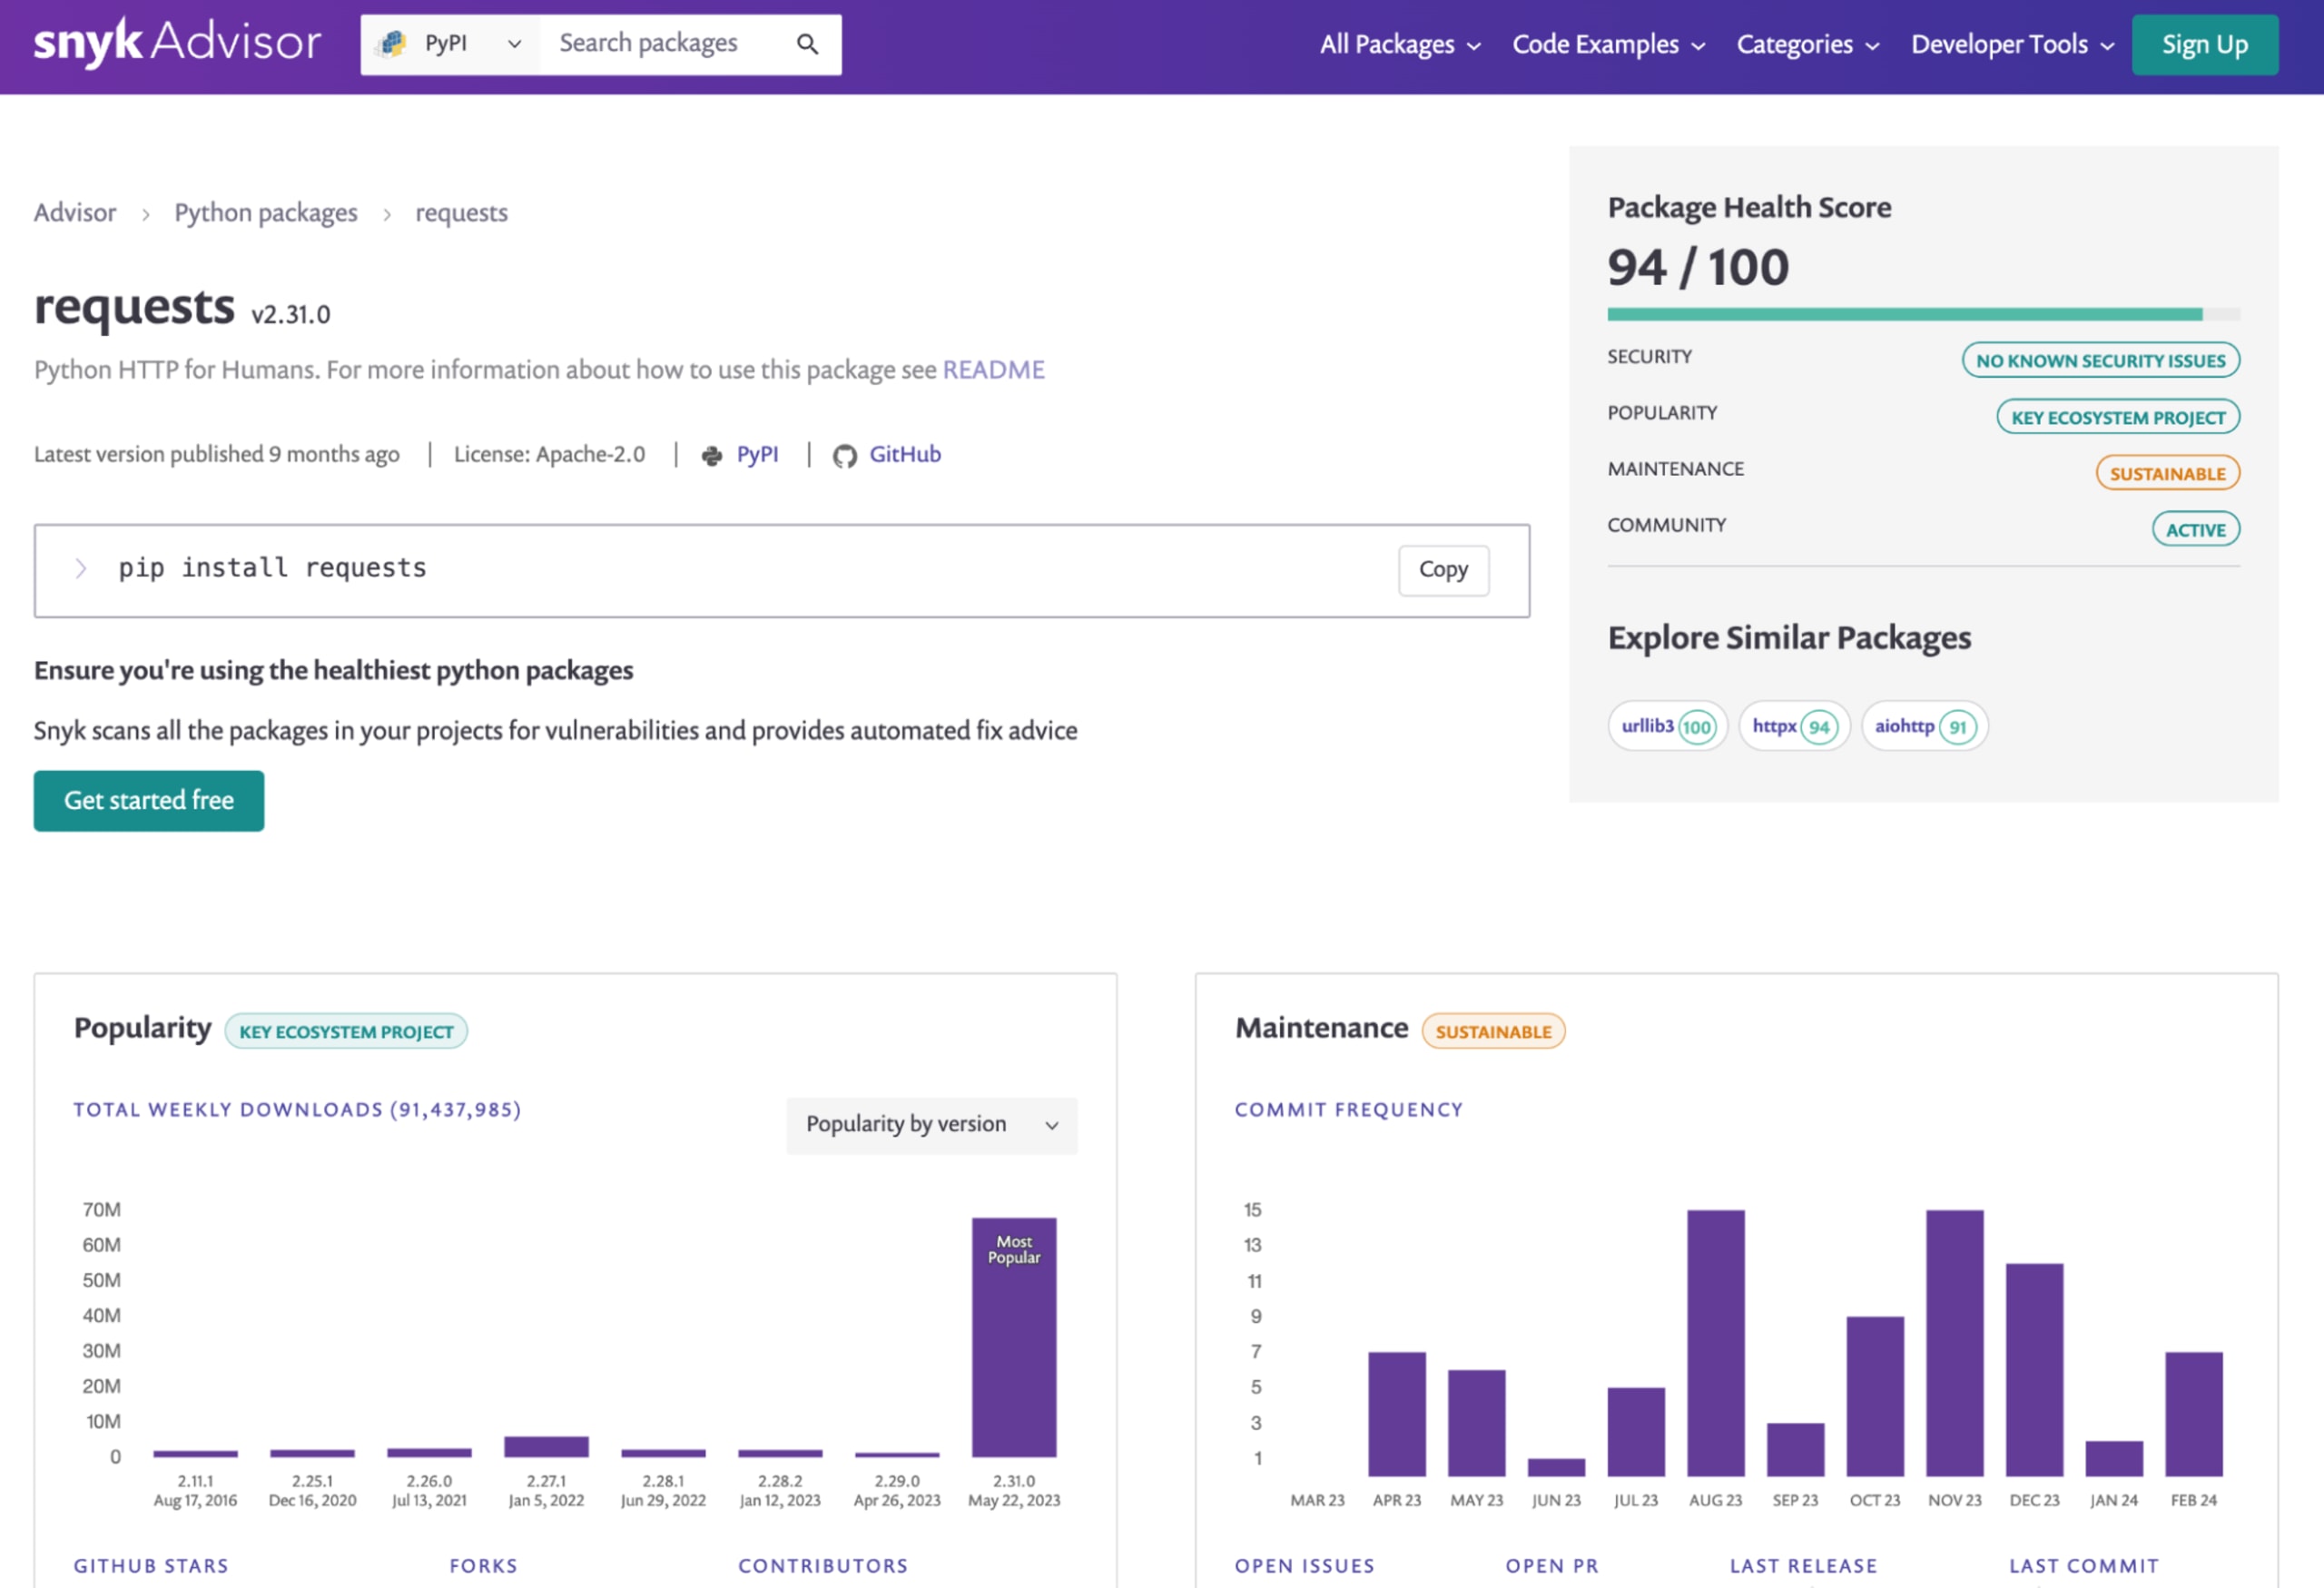
The Snyk CLI can be used to analyze your Python project's dependencies and alert you of vulnerable open source packages installed from PyPI or insecure code in your Python program. After installing the Snyk CLI, you can run the following command to analyze your project:
This command will analyze your project's dependencies and provide a report on any security vulnerabilities, licensing issues, or outdated packages. For example, it might alert you of vulnerabilities when you scan a Python FastAPI project:
Get started with Snyk for Python security to secure your first line of code and all the way to your last pip dependency and your deployed Python container applications.
Using pipenv graph for dependency analysis
Let's consider a simple Python Flask application to showcase dependency analysis in action. Here's the app.py file:
We will use Pipenv for this example. First, initialize Pipenv and install Flask:
Now, running pipenv graph will show:
This output reveals that Flask, our project's direct dependency, depends on click, itsdangerous, Jinja2, and Werkzeug. Jinja2 further depends on MarkupSafe. Thus, we have successfully analyzed the dependencies of our project.
If you're new to pipenv and want to learn more about it, I recommend reading mastering Python virtual environments: A complete guide to venv, Docker, and securing your code to familiarize yourself with the concept of virtual environments in Python.
In conclusion, regular dependency analysis in Python projects is necessary to maintain code reliability, enhance security, and ensure licensing compliance. Tools like Snyk, Snyk Advisor, and Pipenv make this task more manageable and provide a clear picture of the dependency tree.
6. Code formatting tools
Adhering to a consistent code style and format is another aspect of maintaining code readability and efficiency. Code formatting tools play a vital role in this context. They help developers automatically format their codebase according to a set of predefined rules. This not only improves the code's overall quality but also reduces the time and effort required for manual code reviews. Let's introduce you to popular cde formatters like Black and YAPF.
Let's consider an example to understand the difference that a code formatter can make. Below is a piece of Python code before and after applying the Black formatter.
Before formatting:
After formatting with Black:
YAPF Python code formatter
YAPF (Yet Another Python Formatter) is another code formatter for Python that goes beyond PEP8 to provide a more uniform code style. Unlike PEP8, YAPF takes into consideration how the code looks and makes it more readable.
Here is an example of how to use YAPF:
7. Abstract syntax trees (AST) in Python
What is an abstract syntax tree (AST)? An abstract syntax tree is a tree representation of the syntactic structure of source code written in a programming language. Each node of the tree denotes a construct in the source code. The syntax is 'abstract' in not representing every detail appearing in the real syntax.
In Python, when the interpreter executes code, it first converts it into an intermediate form known as bytecode. This conversion process involves the creation of an AST. An AST in Python is a simplified representation of the Python code structure. It strips away details like formatting and whitespace, focusing only on the commands and their order, providing a structural view of the code.
The Python ast module and its capabilities
Python's standard library includes the ast module, which enables the creation, manipulation, and inspection of ASTs. This module provides a set of classes, functions, and helper methods to work with Python ASTs programmatically.
The ast.parse() function is a common entry point to create ASTs. It parses Python source code into an AST node, which can then be manipulated or inspected.
The ast module also provides a NodeVisitor class to walk the AST and call a visitor function for every node found. This class can be used as-is or subclassed to override methods and provide functionality for specific node types.
AST inspection and manipulation: A practical example
Let's dive into a simple example of using the ast module to inspect and manipulate an AST in Python.
In this example, we first parse a simple Python print statement into an AST using ast.parse(). We then inspect the AST by walking through all the nodes and printing their types. After that, we modify the AST by changing the string literal in the Print node. Finally, we convert the modified AST back into code using compile() and execute it with exec(). The output of this code will be 'Hello, AST!', not 'Hello, World!'.
This example showcases the inspection and modification capabilities of the ast module in Python. The potential applications of ASTs in the field of code security and software development are vast, from automated code refactoring to advanced static code analysis for security vulnerabilities.
8. Control and data flow analysis
Control and data flow analysis are vital components. This technique facilitates efficient error detection, boosts code readability, and enhances the overall quality of Python applications.
Control flow analysis involves evaluating the execution order of statements or instructions in a program, while data flow analysis focuses on the tracking and analysis of data values as they change throughout the program. Here are some reasons why these analyses are important:
Detection of potential errors: Control and data flow analysis can help identify potential bugs and vulnerabilities in the code, such as infinite loops, unreachable code, or unused variables.
Code optimization: By understanding how data moves through your code and how control flows, you can identify areas of inefficiency and make necessary improvements.
Enhanced code readability: Control and data flow analysis can help to make the code more understandable by highlighting the dependencies and interactions between different parts of the code.
Security assurance: Understanding the flow of data and control in your application is essential for ensuring security. It can help identify potential security vulnerabilities, such as data leaks or injection attacks.
Code example demonstrating control and data flow analysis
To illustrate the concept of control and data flow analysis in Python, let's consider a simple Python function:
In this function, the control flow is determined by the if-else statement. If the quantity is less than or equal to 0, the function returns an error message. Otherwise, it calculates and returns the total price.
The data flow, on the other hand, can be traced from the input parameters (price and quantity) to the final result (total). The values of these variables change as they pass through the function.
A static analysis tool would analyze this function's control and data flow to detect any potential issues. For instance, it might flag an issue if price or quantity were used before being defined or if there was a possible path through the function where total wasn't defined before it was returned.
Through control and data flow analysis, you can develop efficient, understandable, and secure Python applications. By integrating this process into your software development life cycle, you can uphold code quality and prevent potential security vulnerabilities from creeping into your application.
9. Integration with Python development environments
Python static analysis tools are not meant to be standalone utilities. They are most effective when seamlessly integrated into the development environment, which can enhance development workflows, continuous integration (CI) pipelines, and code editors.
The following describes the roles of Python static analysis tools in these areas and provides a practical example of such integration:
Role in development workflows: Static analysis tools play a pivotal role in development workflows. Python developers can use these tools to identify and fix potential issues during the development phase, even before the code is run. This early detection can save significant debugging time and enhance code quality.
Role in CI pipelines: In Continuous Integration pipelines, static analysis tools can be used to automatically analyze the code in each commit or pull request. This ensures that any new changes adhere to the coding standards and do not introduce potential vulnerabilities. These tools can be integrated into CI pipelines such as Jenkins, GitLab CI, GitHub Actions, etc.
Role in Code Editors: Most modern code editors, such as Visual Studio Code, PyCharm, Atom, and Sublime Text, support the integration of static analysis tools. This allows developers to get real-time feedback on their code structure, style, and potential vulnerabilities as they write the code.
Practical example: Integrating PyLint into Visual Studio Code
PyLint is a popular Python static analysis tool. Here's how you can integrate it into Visual Studio Code, a widely-used code editor.
Firstly, ensure you have PyLint installed in your Python environment. If not, you can install it using pip:
Next, open Visual Studio Code and install the Python extension by Microsoft from the Extensions view.
After the extension is installed, open the settings (File > Preferences > Settings). In the User Settings section, search for Python Linting. Make sure the Enabled checkbox is checked and Pylint is selected in the Linter dropdown.
Now, every time you open a Python file in Visual Studio Code, PyLint will automatically analyze the code and highlight any issues it finds.
Here's a sample Python code and how PyLint would highlight an issue:
In the above code, PyLint would underline c and show a warning message Undefined variable 'c', helping you catch the error before running the code.
10. Performance profiling
Performance profiling is an essential dimension of Python static analysis. It involves examining your code to identify bottlenecks, inefficient sections, or parts of the code that consume significant CPU or memory resources. By conducting a thorough performance profiling, developers can optimize their code, enhancing the overall speed and efficiency of the application.
Performance profiling allows you to measure the complexity of your code in terms of time and space. Time complexity relates to the total time required to execute a program, while space complexity pertains to the amount of memory used by the program. A performance profile provides a detailed report of the function call count, the time spent in each function, and other information that can help optimize the application's performance.
Python code example demonstrating performance profiling
Python provides several tools for performance profiling, but one of the most common is the built-in cProfile module, which provides a robust and flexible profiler. Here's a simple example of how you can use it:
When you run this code, cProfile will generate a report showing how much time was spent in each function. The output might look something like this:
This output shows the number of calls to each function (ncalls), the total time spent in the function excluding calls to sub-functions (tottime), the cumulative time spent in the function including sub-functions (cumtime), and other useful information.
Performance profiling in relation to memory leaks and memory usage is also crucial for production applications. Drew Wright has written a great article on diagnosing and fixing memory leaks in Python from his own experience and struggles with memory leak issues faced during his time in the Snyk engineering team.
Performance profiling has a direct impact on your code. It helps you identify areas of your code that are performance bottlenecks, enabling you to focus on those areas for optimization. Profiling can also help find bugs that might not be visible during regular testing. Moreover, performance profiling can influence the way you write code. A proper understanding of time and space complexity can guide you to write more efficient code, ultimately leading to improved application performance.
Conclusion
Static analysis is a powerful tool that can significantly improve the quality of your code and make it more secure. By leveraging the ten dimensions of Python static analysis we've discussed in this article, you can enhance your software development process, prevent potential bugs from being introduced into your codebase, and ensure your applications are less vulnerable to security threats.
The dimensions of Python static analysis work together to uncover potential problems before they become actual issues in the production environment. By catching bugs early, you save on the costs associated with fixing them later. Python static analysis is also essential for ensuring code security. It can uncover potential security vulnerabilities that would be easy to overlook in manual code reviews. By incorporating Python static analysis into your software development process, you can make your applications more secure and protect them from potential attacks.
Encouraging developers for better code and security
I hope that this article has provided you with a better understanding of the ten dimensions of Python static analysis and how they can be used to improve code quality and security. Remember, high-quality, secure code isn't just about preventing bugs or vulnerabilities — it's about creating software that's reliable, robust, and capable of standing up to the challenges of the real world.
Do you know how to prevent command injection in Python? how do you protect against code injection in Python?
Following Python security best practices is essential for ensuring the security of your Python applications. Start today with a free Snyk account and install the Snyk IDE extension to quickly and easily find and fix security vulnerabilities in your Python code.