Advanced IntelliJ debugger features you’re missing out on
January 30, 2023
0 mins readI recently finished writing my debugging book and a debugging course. And as a result, I frequently get asked about my favorite debugging features. Debugging is much more than the IDE debugger. In fact, only the first chapter in the book deals with that aspect. But when we think about debugging, tour mind gravitates to the IDE. However, there are still many nooks and crannies to discover inside these amazing tools.
The core reason for this is simple — we never learned to debug. You can’t test debugging knowledge, so universities don’t teach it.
We learn it on the job as we go along, which is terrible. No wonder some developers treat debugging like taking out the trash — holding their noses and running to the door in order to get rid of it. Debugging is much more than the sum of its parts, and debuggers are fantastic tools that help us gain deep insight into our work. They expose the inner workings of the application in a completely new light and give us a level of insight that no other craft has.
In this post, we will cover three debugger features that I’ve found to be audience favorites when giving talks on this subject. While all of these features should work with most JetBrains IDEs, unfortunately all three features aren’t available in VS Code. I believe this was a conscious user experience choice by the VS Code team, in order to simplify the environment — a choice I hope they will reconsider.
Three Intellij debugging features:
Debug configuration with marker objects
Entry renderers
Memory tracking
IntelliJ debug configuration with marker objects
One of the biggest challenges during debugging is keeping track of your work. We stop at a breakpoint and see an object. Was this the object we saw before? Does it have the same reference, values, identity, pointer address?
I used to write pointer addresses on a piece of paper to keep track of what I’d seen and verify that it wasn’t a new address. This is frustrating and confusing. I can’t even read my handwriting… There has to be a better way?
There is. When we inspect an object in the debugger instead of writing the value down, we can mark it using the context menu.
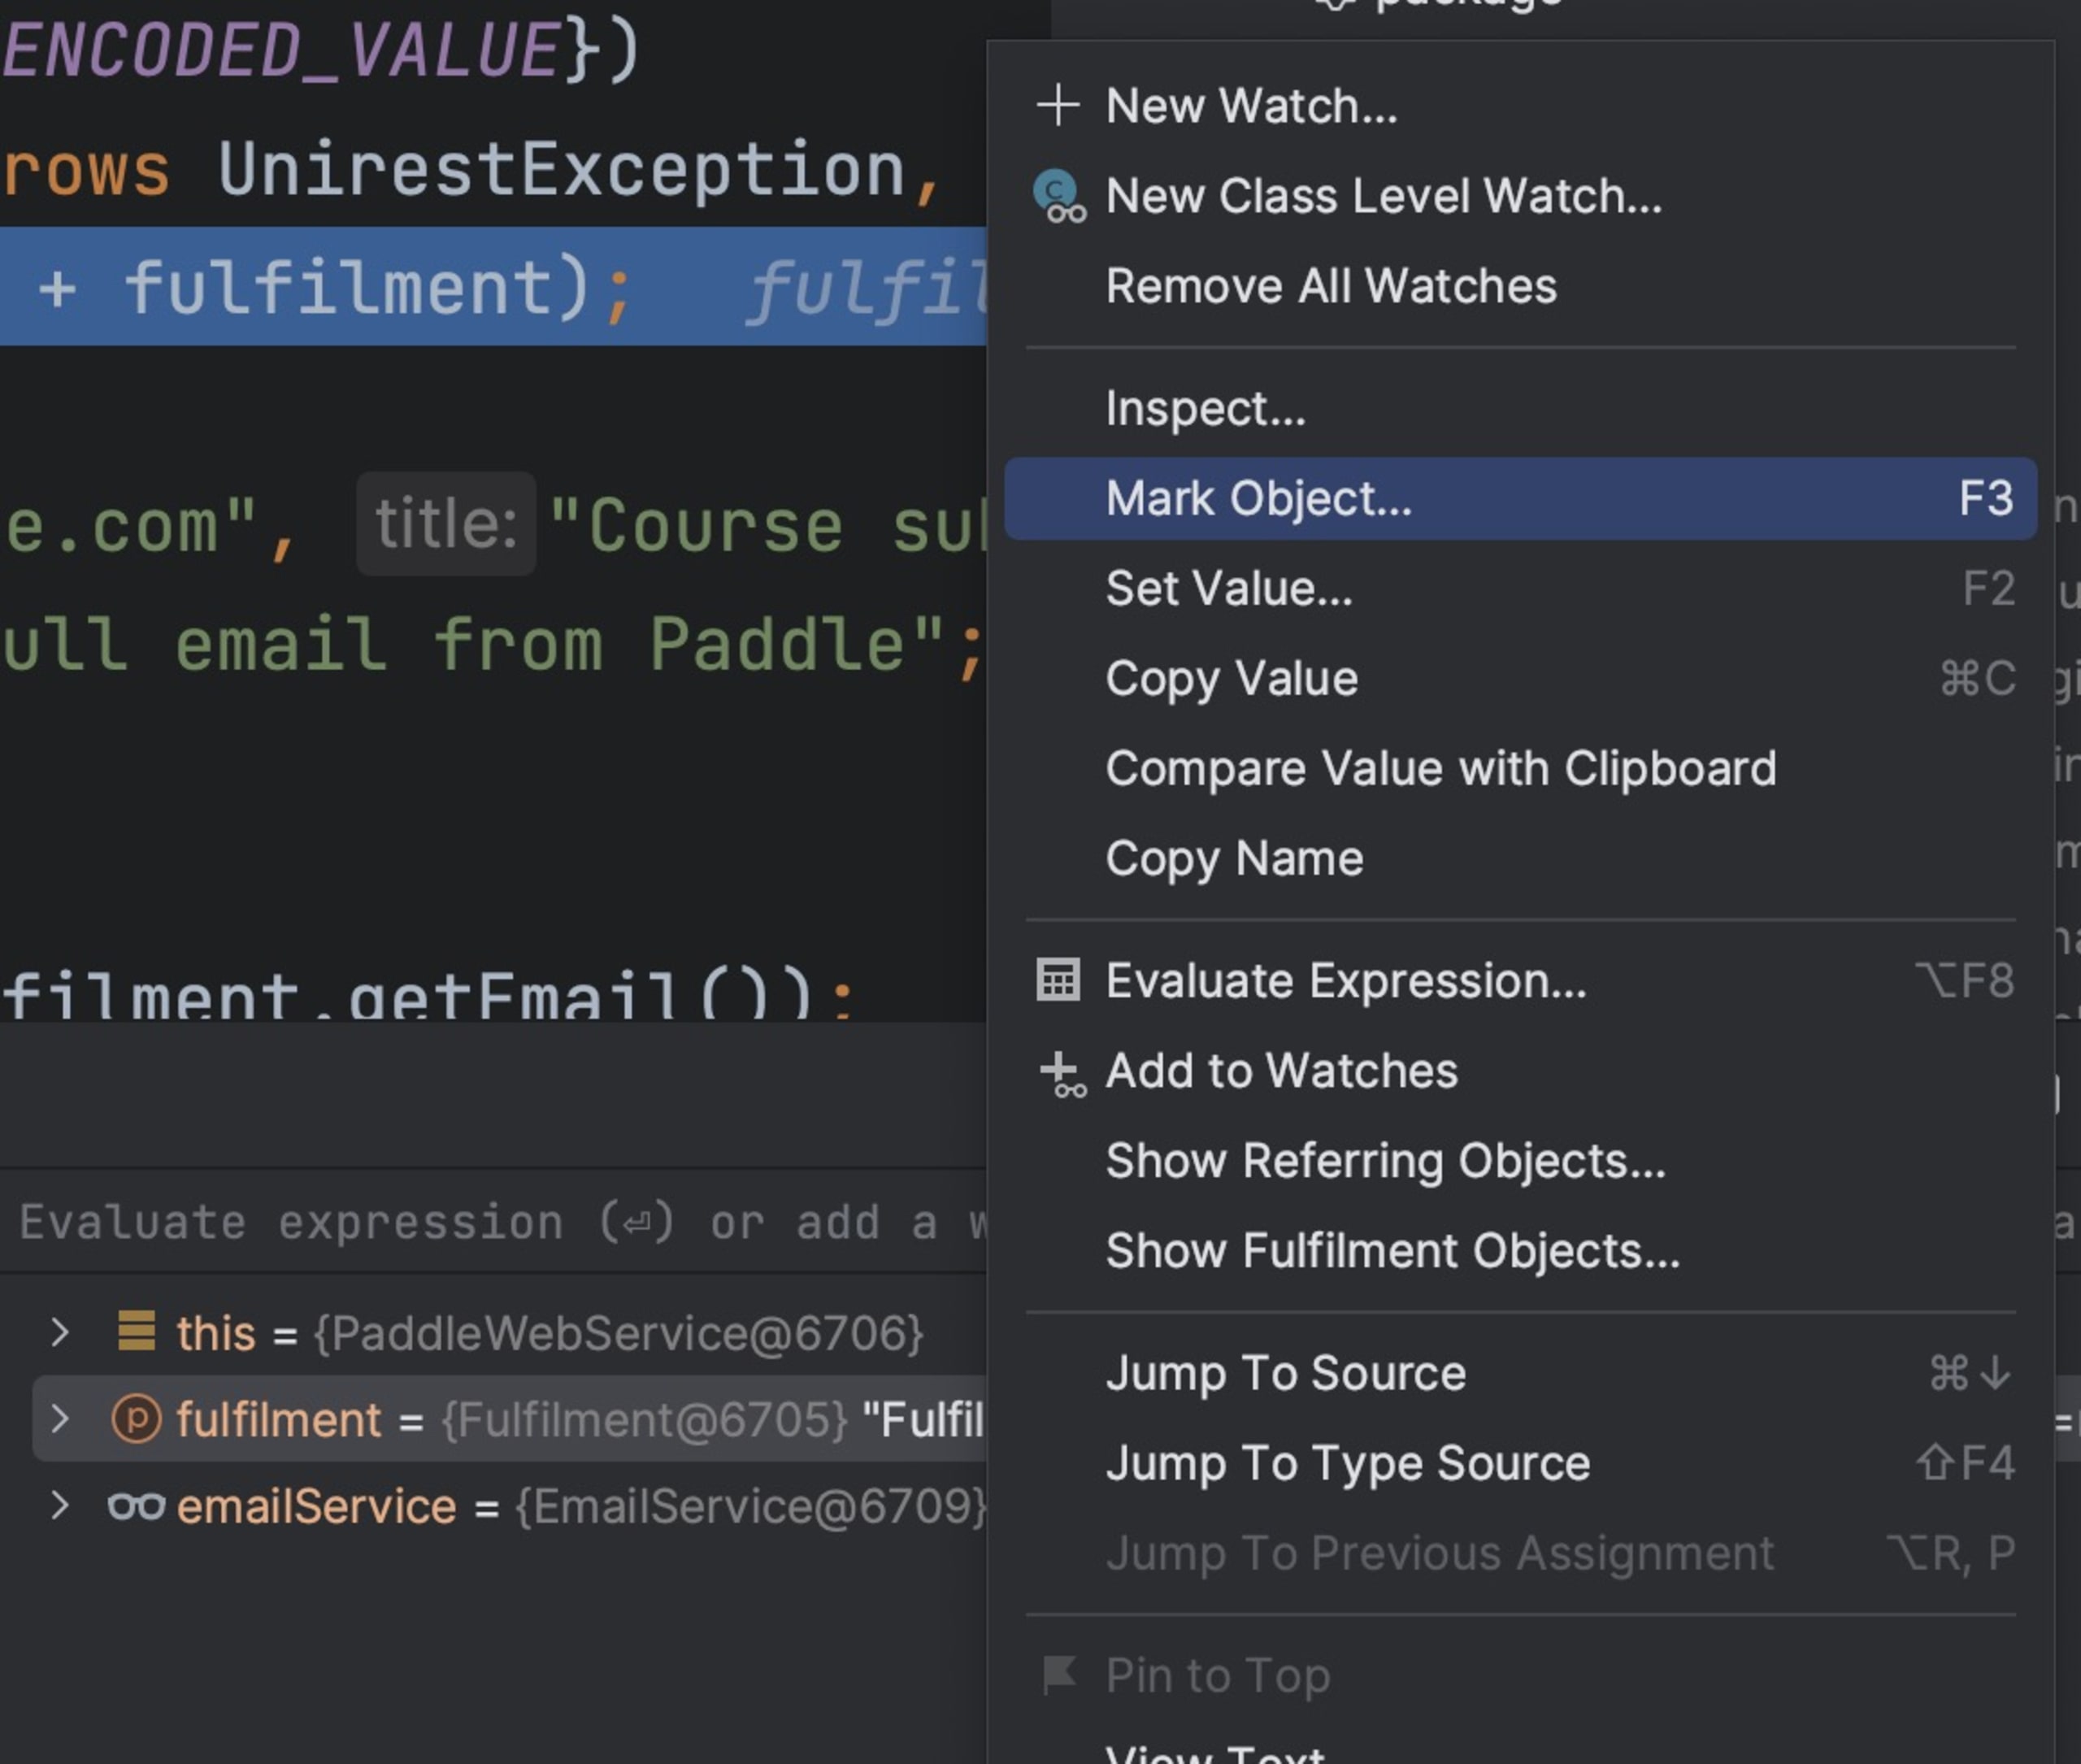
Once we select that option, we’re prompted to give the object a name. This is a confusing dialog. You might incorrectly assume that this is just an alias to the watch entry. It isn’t.
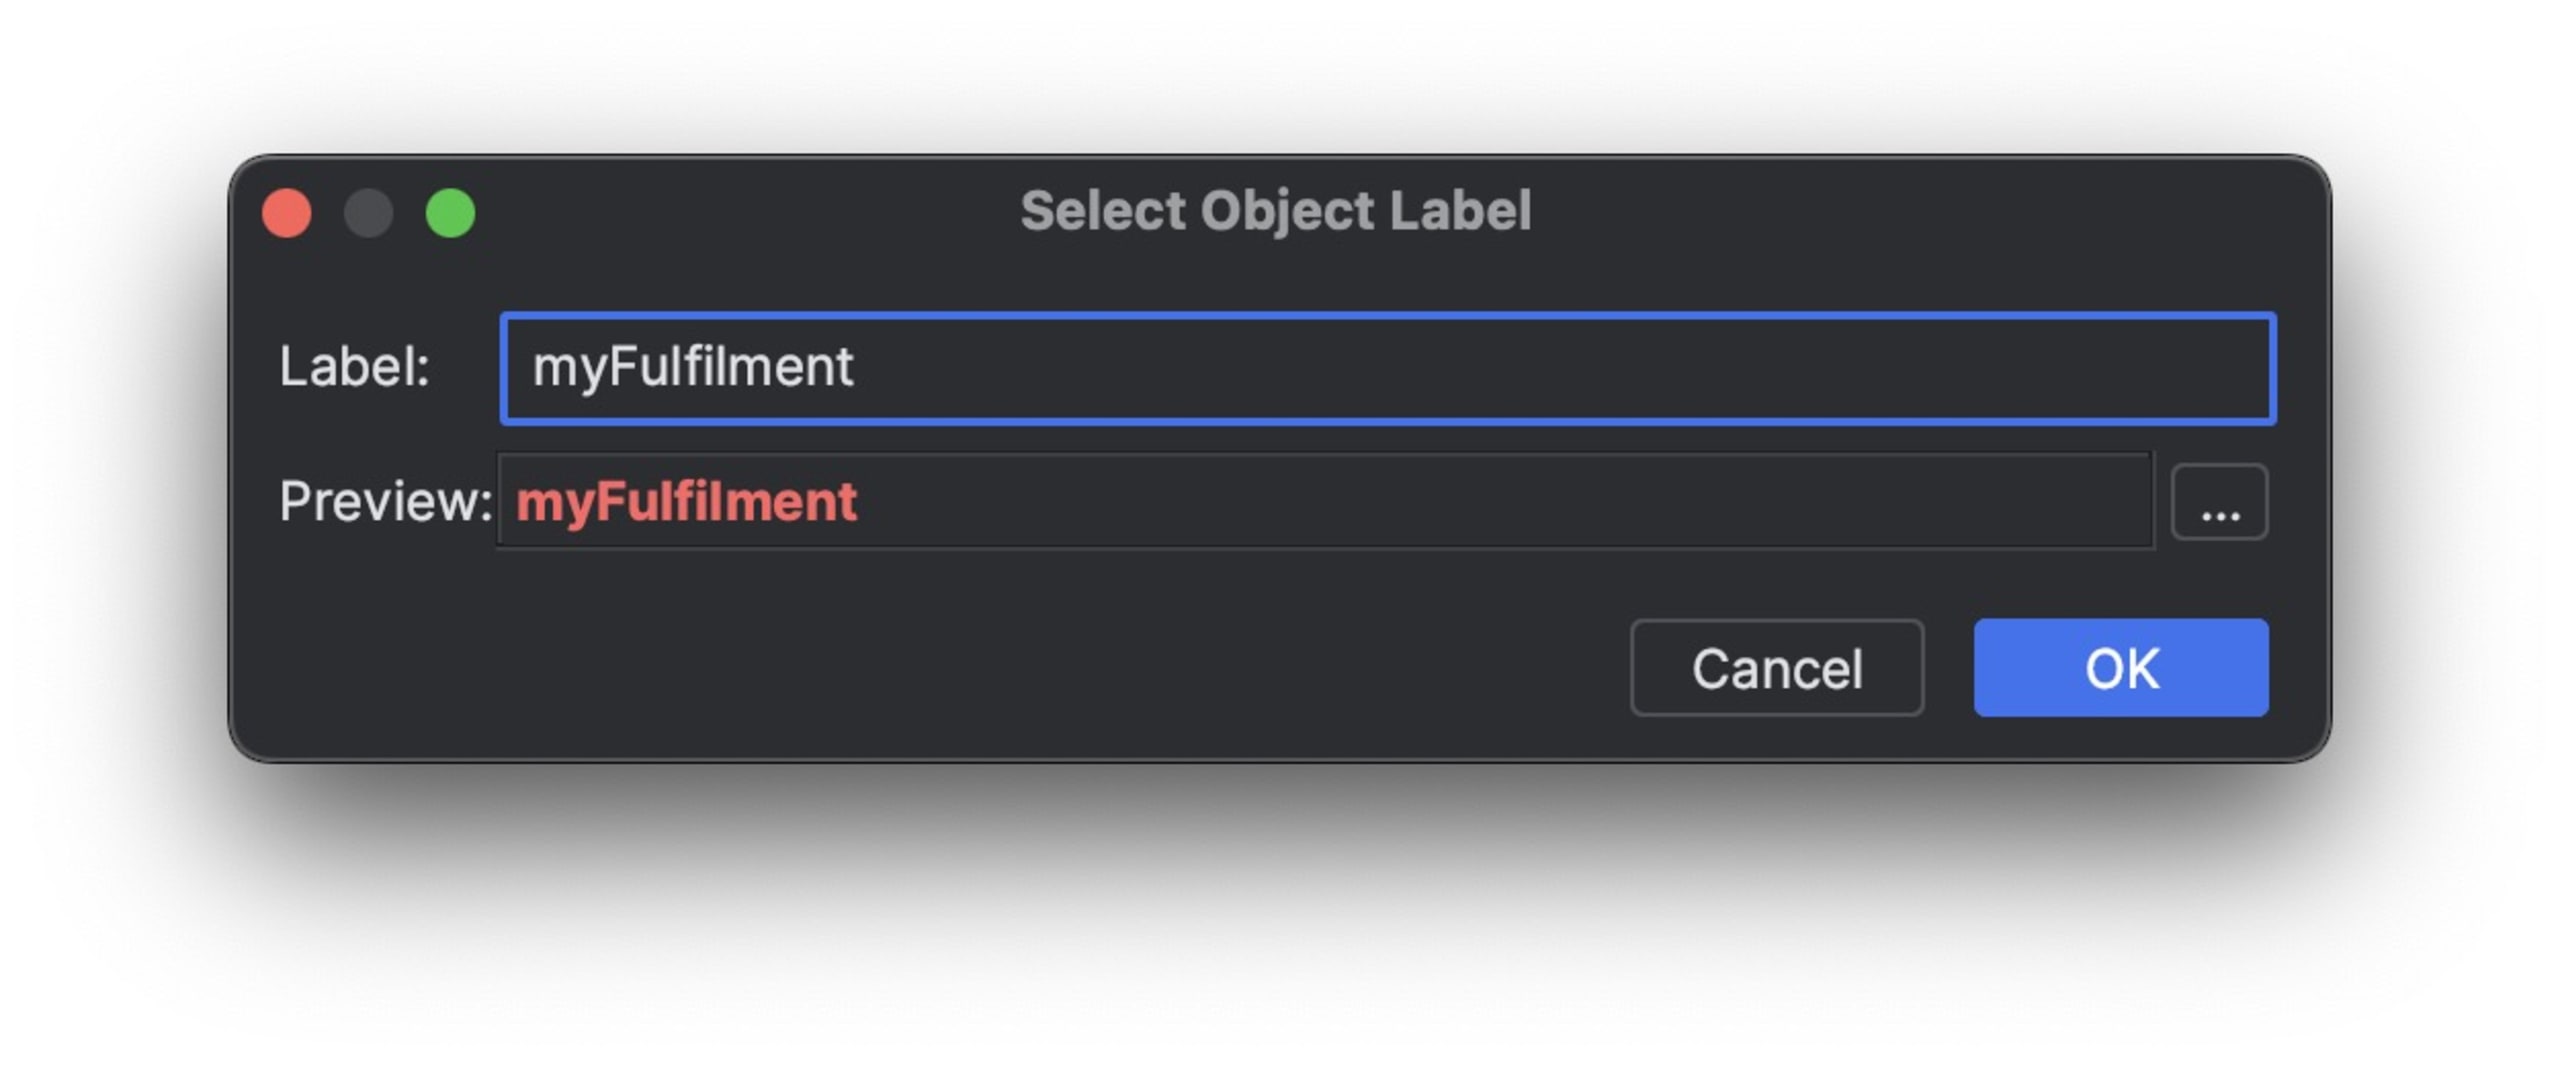
What we’re doing here is defining a new global variable. We can inspect the value in the watch regardless of the scope (which is cool enough), but we can also use it in conditional statements, so a breakpoint will only stop if the value changes — as we can see here.
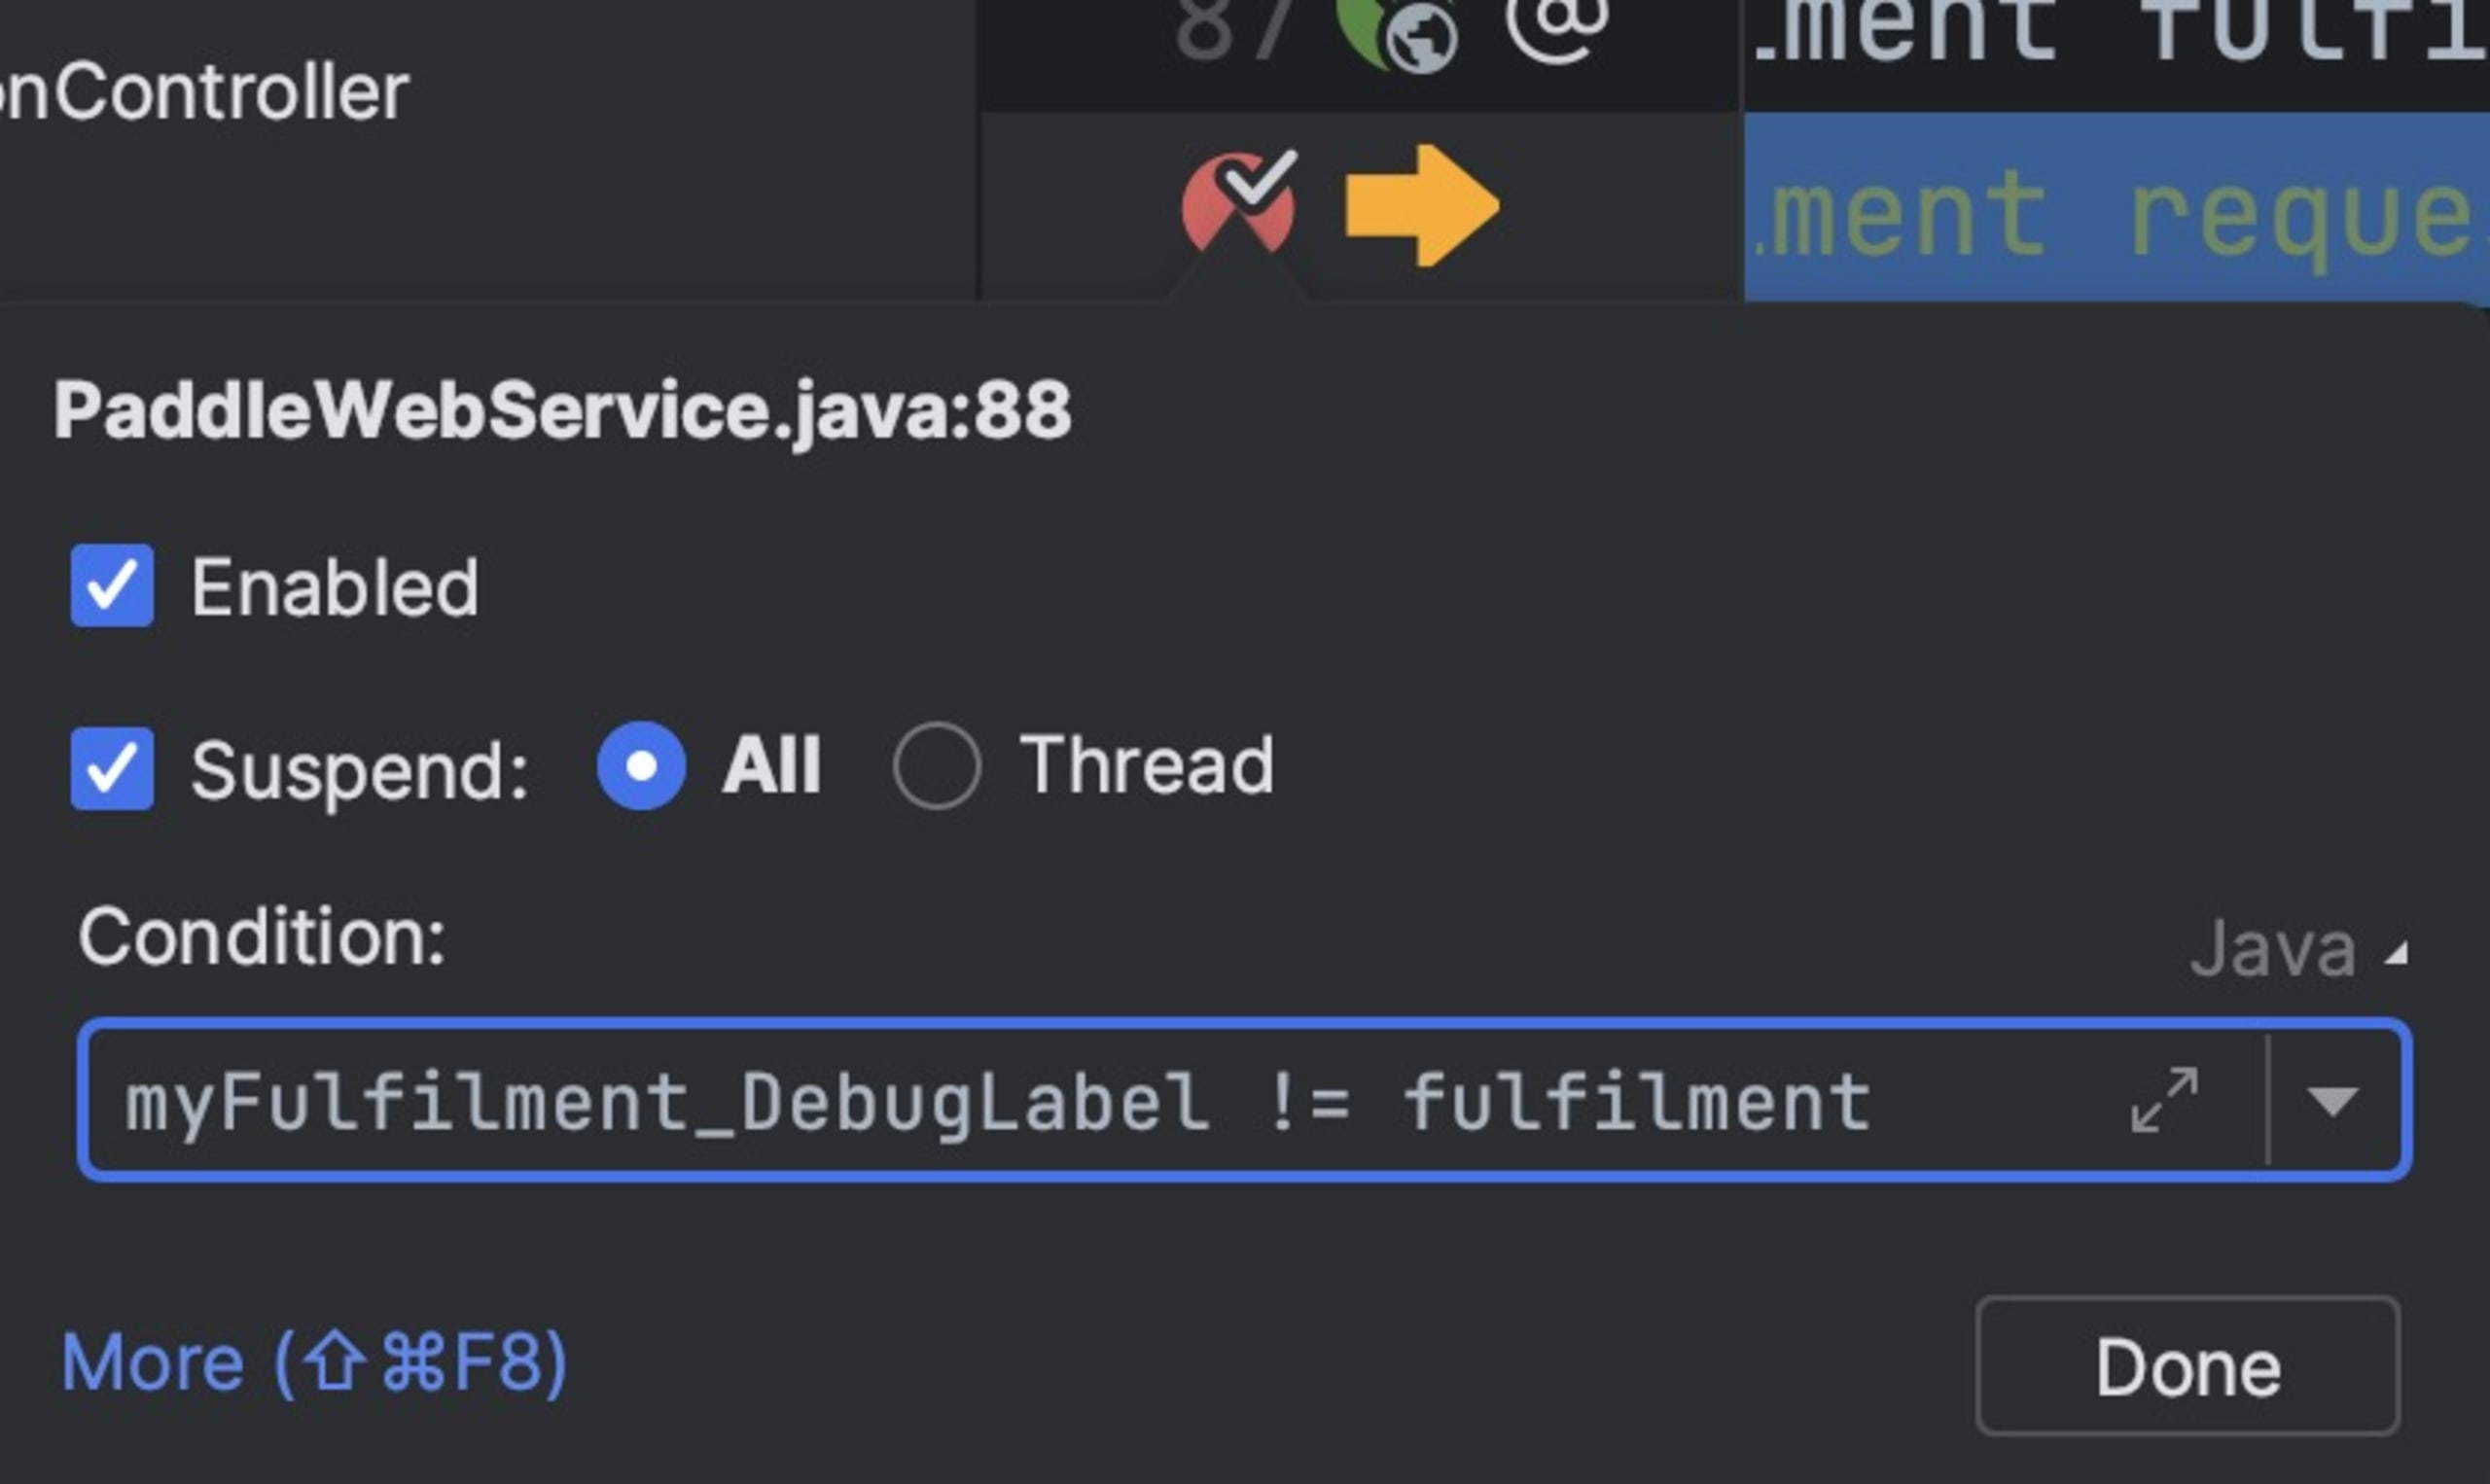
This is remarkably powerful. We can use it to detect threading issues by marking the current thread. You can also use it to keep track of objects that have the same identity, but different pointers. A good example would be object-relational mapping, where we might have two instances of the same entity concurrently. Those bugs are very hard to track.
Entry renderers
The watch area is one of the most fantastic features of the modern IDE. As we step over code, it gives us all the information we need at a glance. But sometimes that “glance” is more of a fishing expedition — leaving us to expand variables and dig deep into a complex hierarchy just to find that one variable value we care about.
In Java, a common workaround is to override toString() with a more descriptive value. But there are several reasons this might not be what I want:
This might not be my object – it might be an object defined by the framework.
It’s possibly something that’s specific to me. I don’t want to change
toString()for everyonetoString()is important and can strongly impact the performance of the application (because of logging costs, etc.).toString()is too basic. What if I want to inspect a variable that contains a list of elements?
Renderers let us leverage the power of the watch area, without the drawbacks. I’ll demonstrate this over a slightly modified version of the Spring Pet Clinic demo. The demo uses Java Persistence API (JPA) for storage. The Spring Data support includes a concept of a repository. A repository can be thought of as a database table. This isn’t “exact” as a repository is a wider abstraction, but generally it’s an approximation we can make.
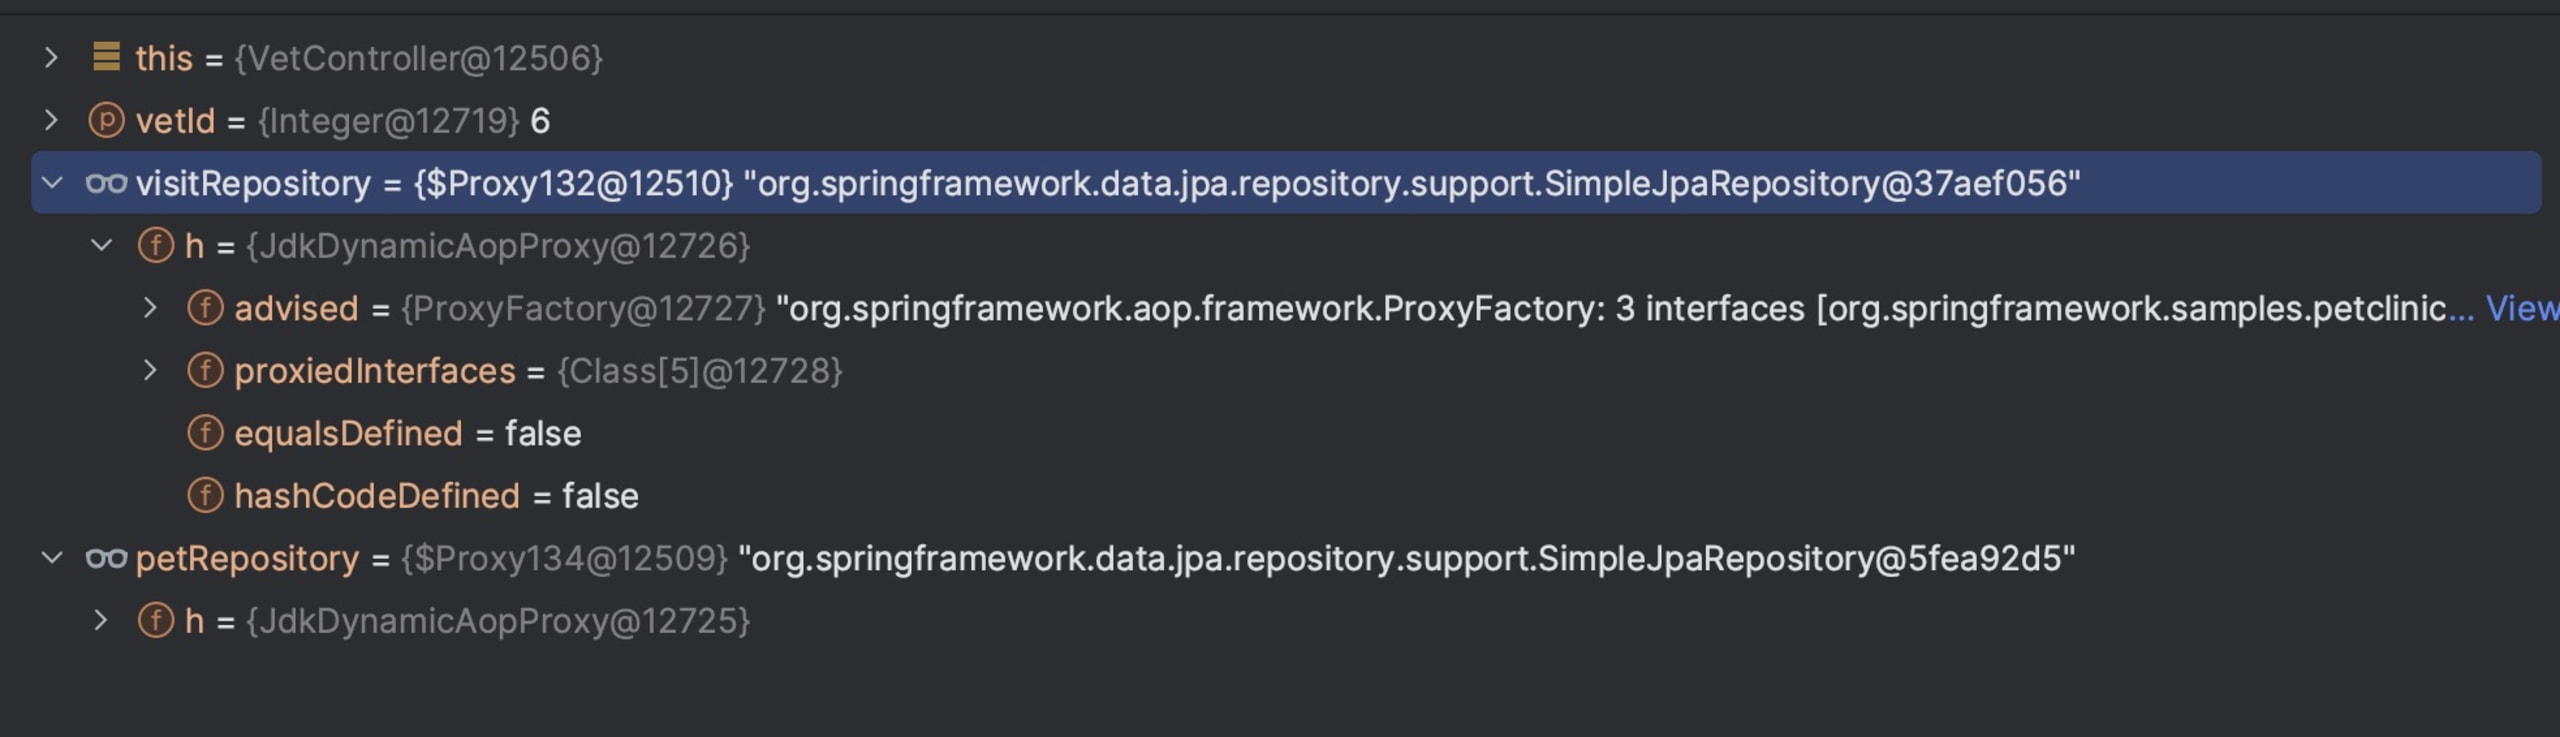
When hitting a breakpoint, we typically see the useless mess in the following picture. visitRepository is a repository, yet it provides no information that’s useful for me when debugging. How many elements do we have in the table? What are their values?
I can further expand the watch entry but it won’t lead me anywhere, this proxy object provides no valuable watch information.
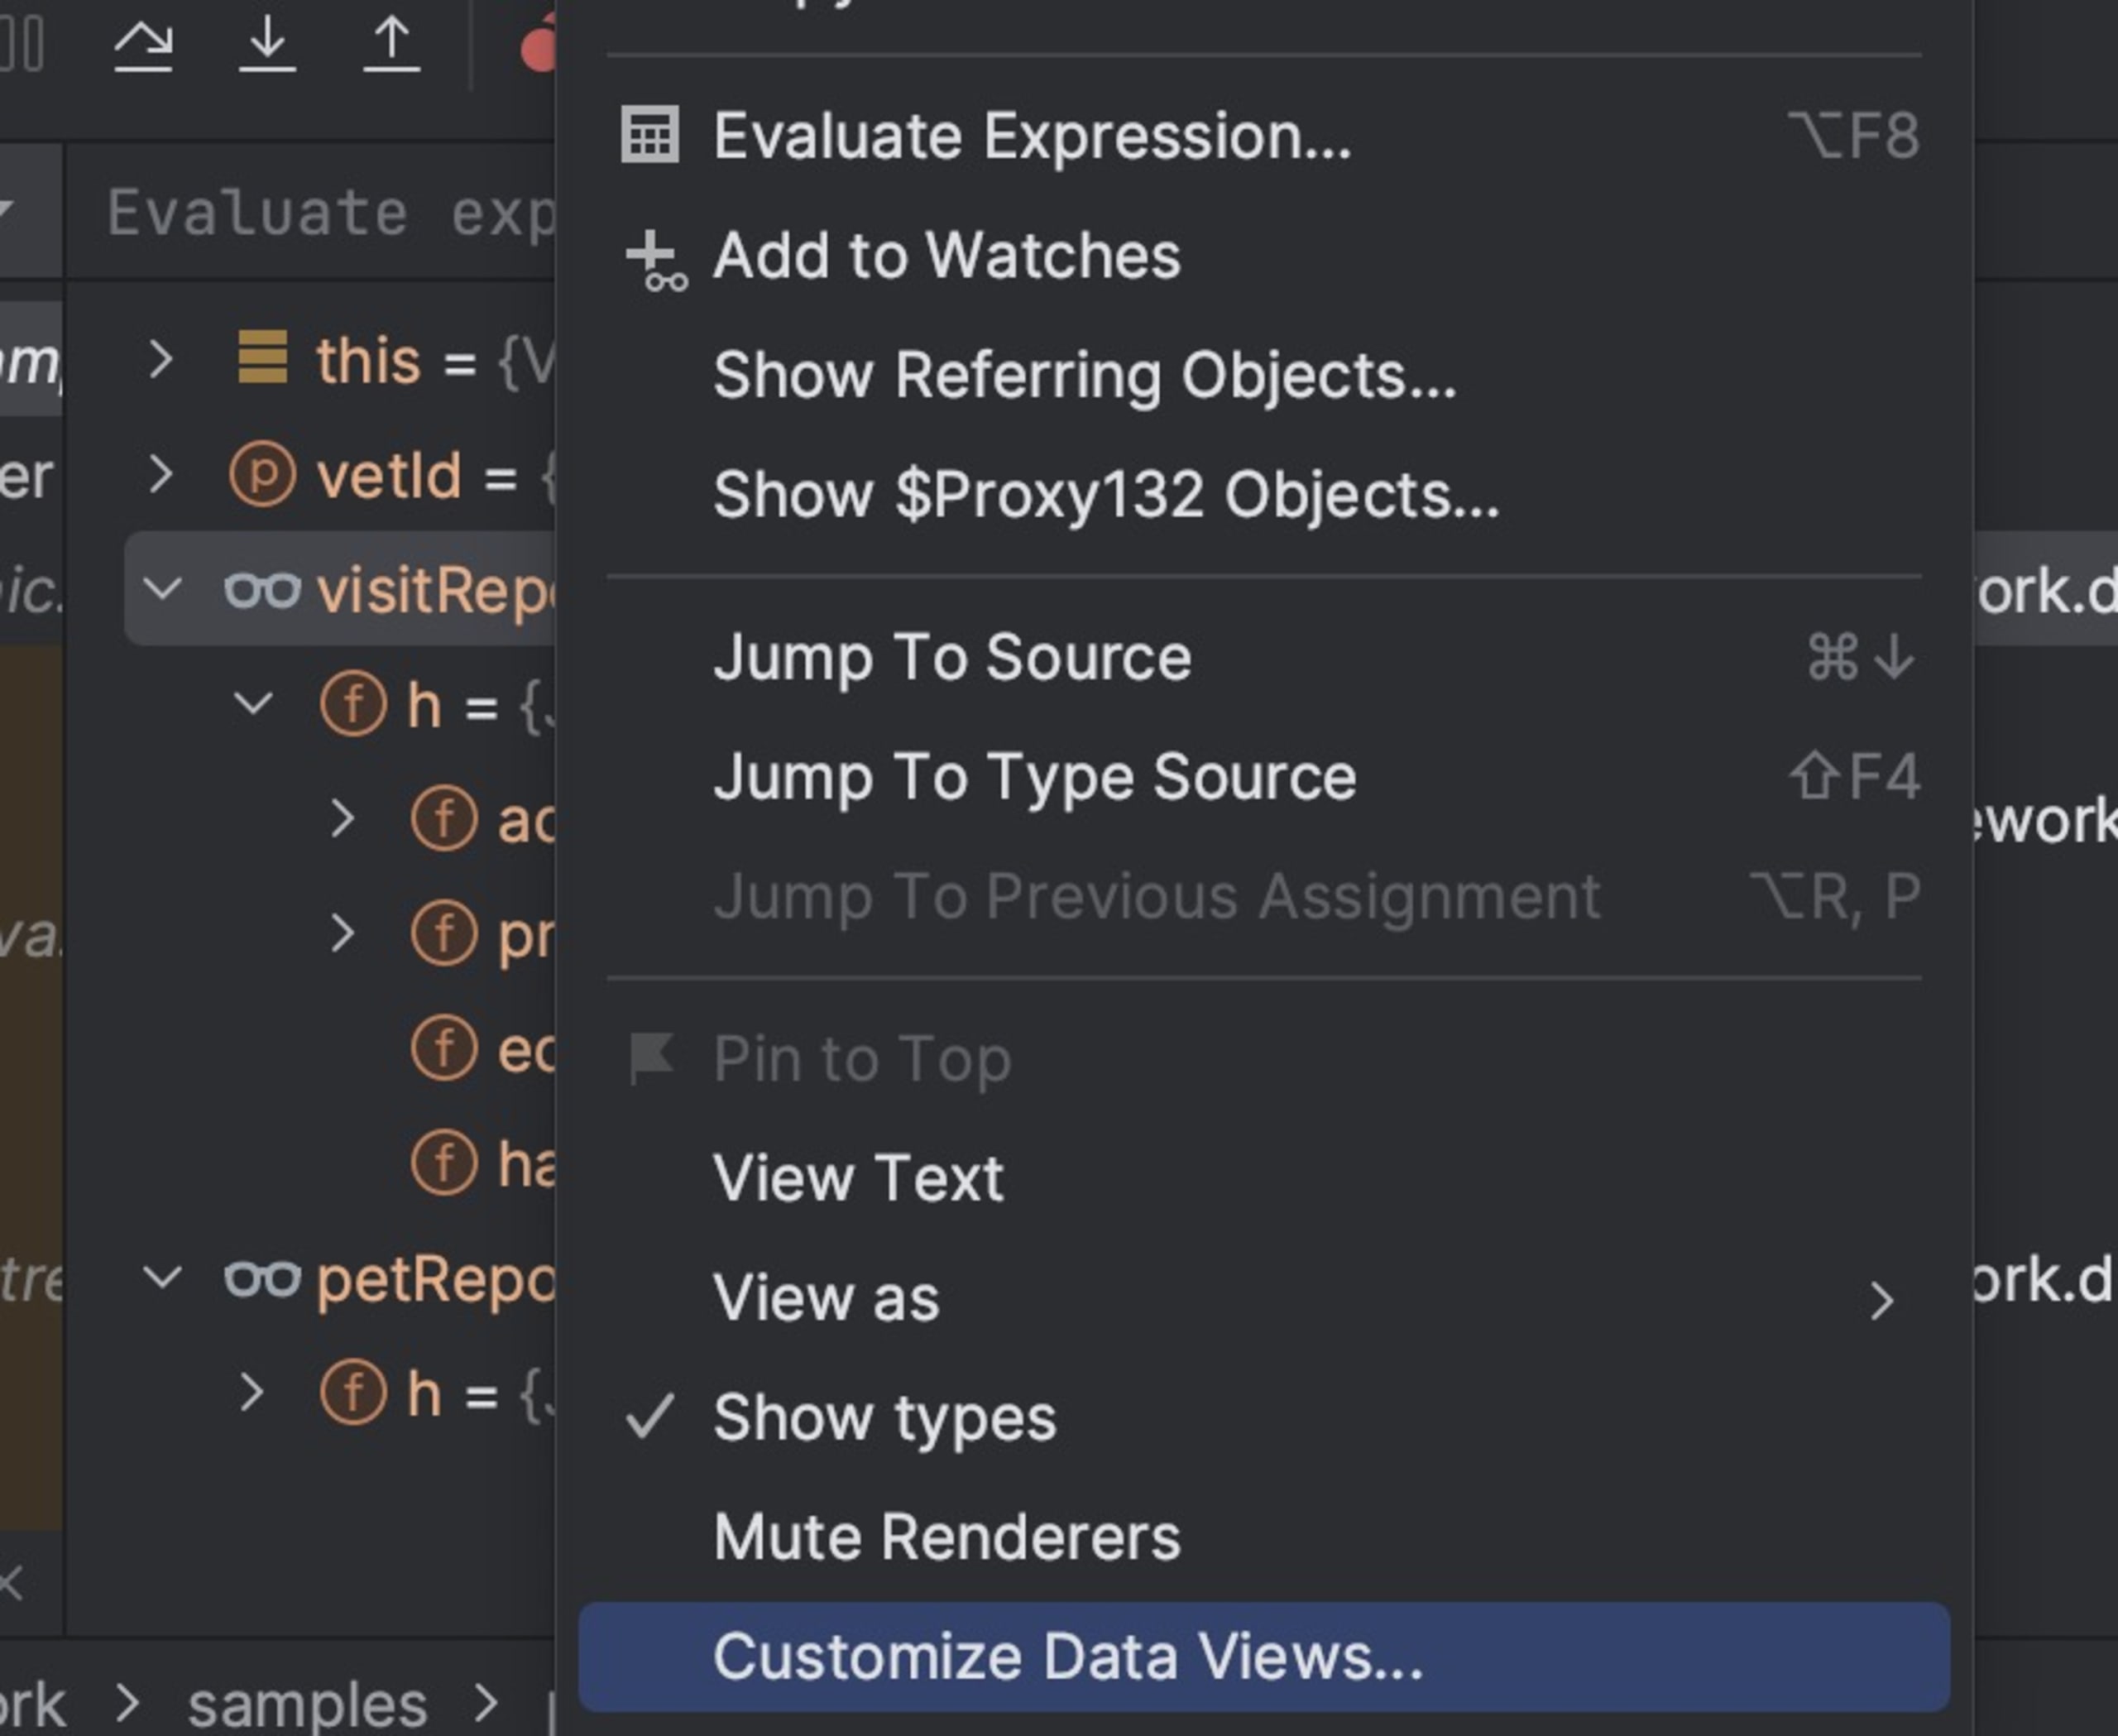
We can do better than by using renderers. To get started, right click the watch area and select Customize Data Views.
In the following dialog, I can define the elements of my renderer to get a far more valuable outcome. The watch area now lets us see the number of elements at a glance and review each element individually if we choose to!

On the left, you can see how this works. We choose to customize the JPARepository. Notice that perRepository in the watch area is a different repository type, that’s why it wasn’t impacted. Next, we’ll define the applicable code that will execute to implement rendering. Invoke the count() method on the object to get the number of objects and create a string to display in the watch.
The second part is even cooler. We can leverage findAll() to gather the elements from the repository and display when the object is expanded. The last part determines if a plus sign should be shown next to the repository to allow expansion.
That’s amazing. But it has one major drawback — we need to do this for every object type we define. That’s tedious… Or is it?
We can define annotations that represent these configurations and effectively package solutions like this right into our library distribution. This can make debugging 3rd party libraries much easier.
Memory tracking
When talking about memory, we start thinking about profiling tools. What better way is there to track memory?
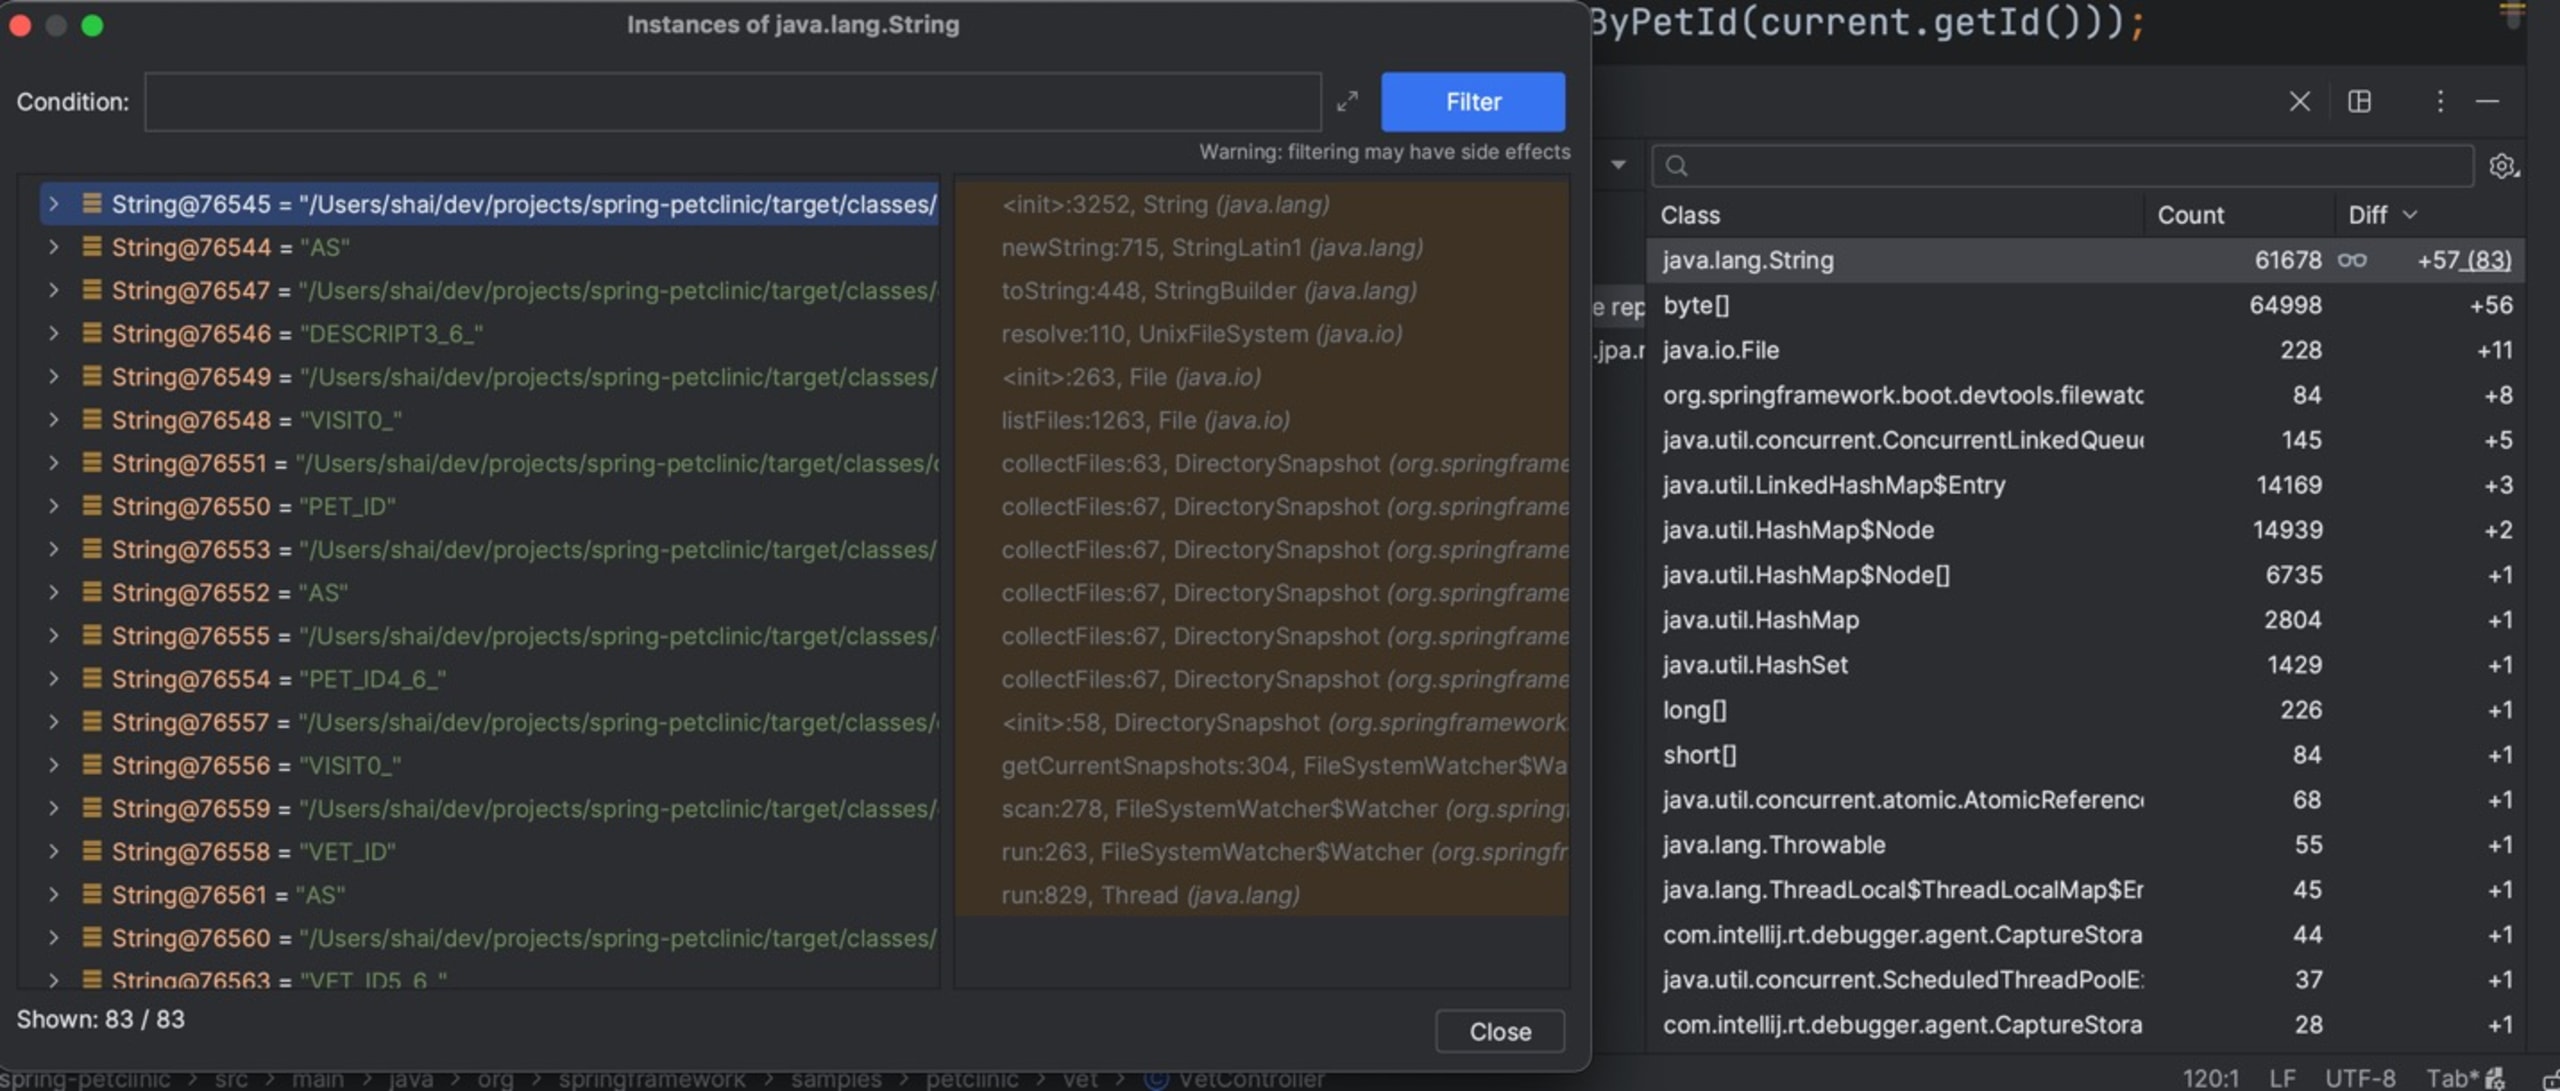
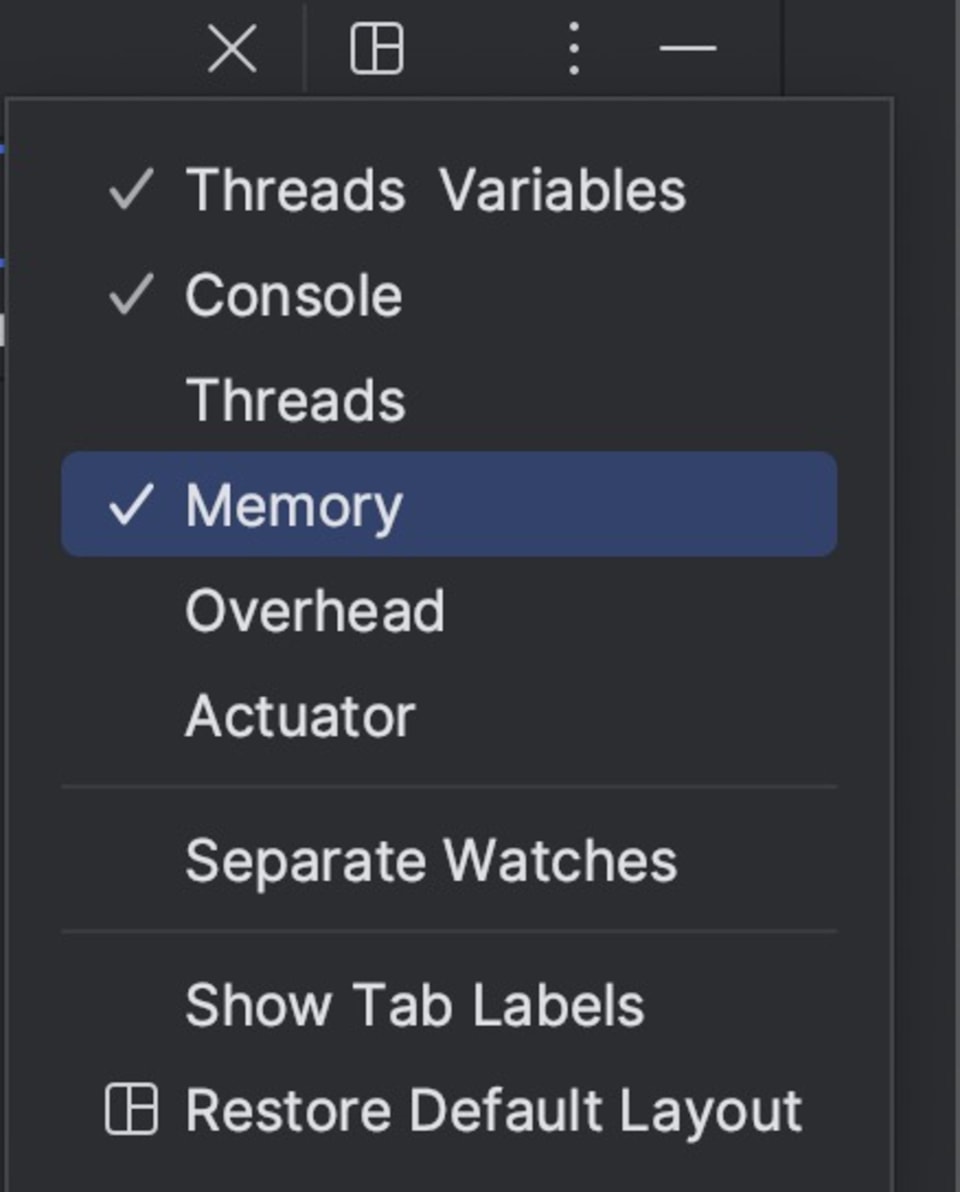
Profilers are great. No doubt. But they’re a broad instrument. They’re missing a “last mile” solution when we’re honing in on a bug. They’re also unsuitable for tracking a wayward object or getting a refined view of the system. For example, we can enable the memory view by clicking in the top right-hand side of the watch area and enabling “Memory”.
Once we do that, we can see a list of objects in memory and can double click each object to get a full list of the objects within. We can also see the number of objects for every given type that were allocated between this breakpoint and the last one in the “diff” column.
This alone is amazing. But it’s also limited. We don’t know which objects were allocated at any given time. To do that, the IDE would need to track every object allocation of every type and keep a reference to every object ever. That isn’t tenable. But we can pick a specific object type, right click it, and select the Track New Instances option.
I did that for java.lang.String in the screenshot above. That’s what the watch icon next to it means. This lets us see the specific objects allocated between one breakpoint and the next. That’s tremendously useful as we can gain insight into what our system code is doing under the hood. But there’s more…
Once we do that, we can also get the full stack trace for every object allocation and see the lines that triggered it. This helps us understand every allocation and the reasoning behind it. We can use that to understand what’s happening under the hood in systems that are big and unfamiliar.
It’s the perfect complement to your profiler.
Finally
I hope this post generated the WOW effect I was aiming at. I think developers look at the debugging process with unwarranted trepidation. A lot of that is due to lack of tooling, processes, and proper mentorship.
Debugging should be a cleansing experience. It’s humbling, we all feel like beginners when debugging, but that’s not a bad thing. Despite its challenge, the process should be fun and exciting. We should celebrate the tools at our disposal and use them to their full extent.
Don’t treat your next bug like a hit and run. Treat it like an adventure. An adventure where you get to take out these new toys from the garage and assault that bug with these new skills.