Reachable vulnerabilities: how to effectively prioritize open source security
Krysztof Huszcza
August 18, 2020
0 mins readA common problem our clients report is being overwhelmed by vulnerabilities.
For small projects, you might end up depending on dozens, or even hundreds of open source libraries. For large enterprise applications, it might feel like your dependencies include half of the ecosystem. The proliferation of third-party dependencies leads to the proliferation of vulnerabilities associated with those dependencies. While most developers grudgingly accept the size of their project's third-party footprint, shipping an app with hundreds or thousands of known vulnerabilities usually crosses the line.
When being overwhelmed with vulnerabilities affecting your app, a reasonable question to ask yourself is, are all of these issues even exploitable? What if some vulnerabilities live in the third-party code which is never executed by your app? In other words, what if some vulnerabilities are never reachable from your application code? If you knew that, you could deprioritize fixing the unreachable vulnerabilities and, instead, focus on the reachable ones, i.e. the ones which are actually affecting you right now in production. You would still have to eventually sort out all vulnerabilities but, at least, you would know where to start.
Sounds perfect—but how do you actually determine which vulnerabilities are reachable and which are not? At Snyk, we solve this problem by combining expert security research with automated static analysis. Let's dive a bit deeper into this solution.
Vulnerable functions
Firstly, let’s take a look at the security research part which aims to answer a very important question—what code is actually vulnerable?
For each vulnerability, we want to know which code lines, functions, classes, or modules within a given library pose the security risk. This is crucial—we cannot say that the vulnerable code is reachable or not without specifying what the vulnerable code is. Unfortunately, publicly available vulnerability databases do not provide this data.
So, how do you identify the vulnerable code? One way, which we found works well in practice, is a manual curation by security experts. Internally at Snyk, we have a team of security analysts and researchers, who continuously analyze vulnerabilities affecting our clients. They research each vulnerability before they add it to our database, and they annotate each vulnerability with metadata which points to the actual vulnerable code.
To describe which code is vulnerable, we decided to use program functions. For each vulnerability, we store a set of function names and signatures. These functions sometimes literally contain the vulnerable code, while others contain the functions which enable the vulnerable behavior. Regardless of their actual relationship to the vulnerability, we call them "vulnerable functions". Which functions we choose as vulnerable functions for a given vulnerability is decided on a case by case basis.
Call graph reachability analysis
Once we identify vulnerable functions for each library, we need to decide whether these functions are used by the application. And here is the second part of our equation—static analysis. We use static analysis to create the call graph of the input program and we use that call graph to reason about the reachability of vulnerable functions.
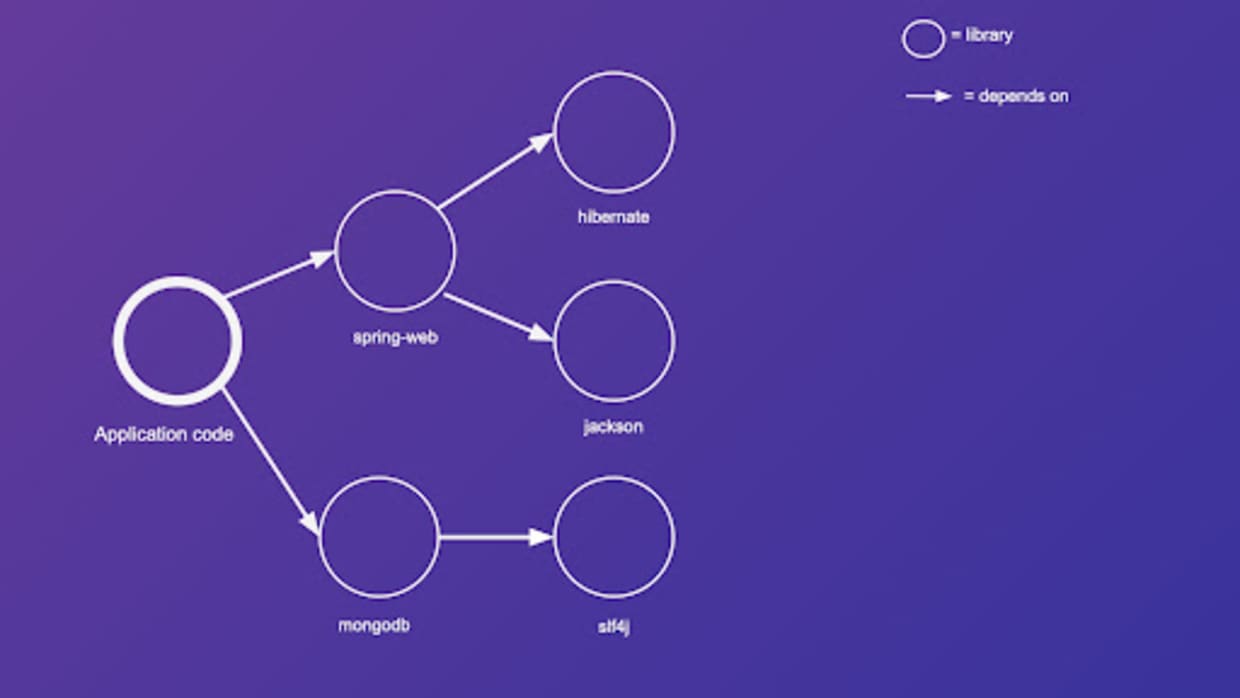
Before we dive into static analysis, let's use an example to illustrate how a call graph can be used to determine vulnerable code reachability. Let's assume we have a Java webapp, which has two direct dependencies—spring-web and mongodb. spring-web further depends on another two libraries—hibernate and jackson. mongodb depends on slf4j. We can illustrate these relationships as a dependency graph.
Now, let's add more detail to the graph by considering function calls. Let's massively simplify our components by assuming that the application code, as well as all third-party libraries, have only two functions—except spring-web which has three functions. Let's add all functions as nodes to the graph and let's add an arrow from function A to function B, if, and only if, function A calls function B.
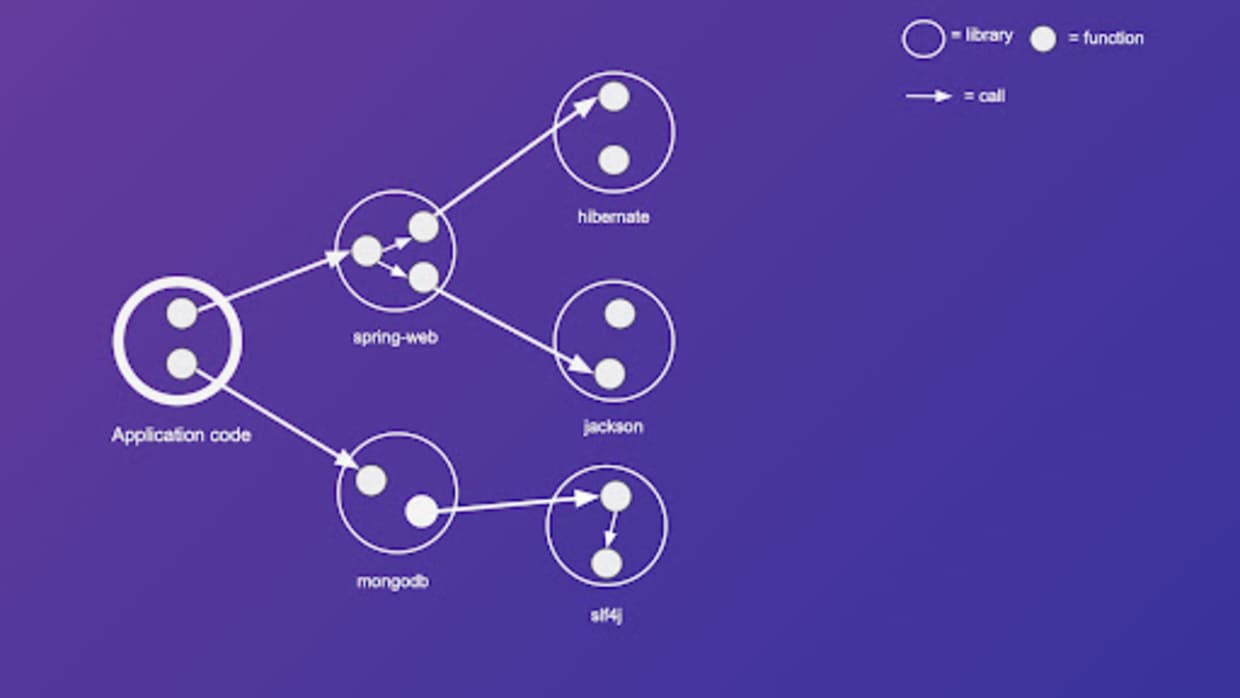
The result is a widely known data structure called a call graph. Now let's add vulnerable functions to our call graph. To depict vulnerable functions, we use a cookie monster.
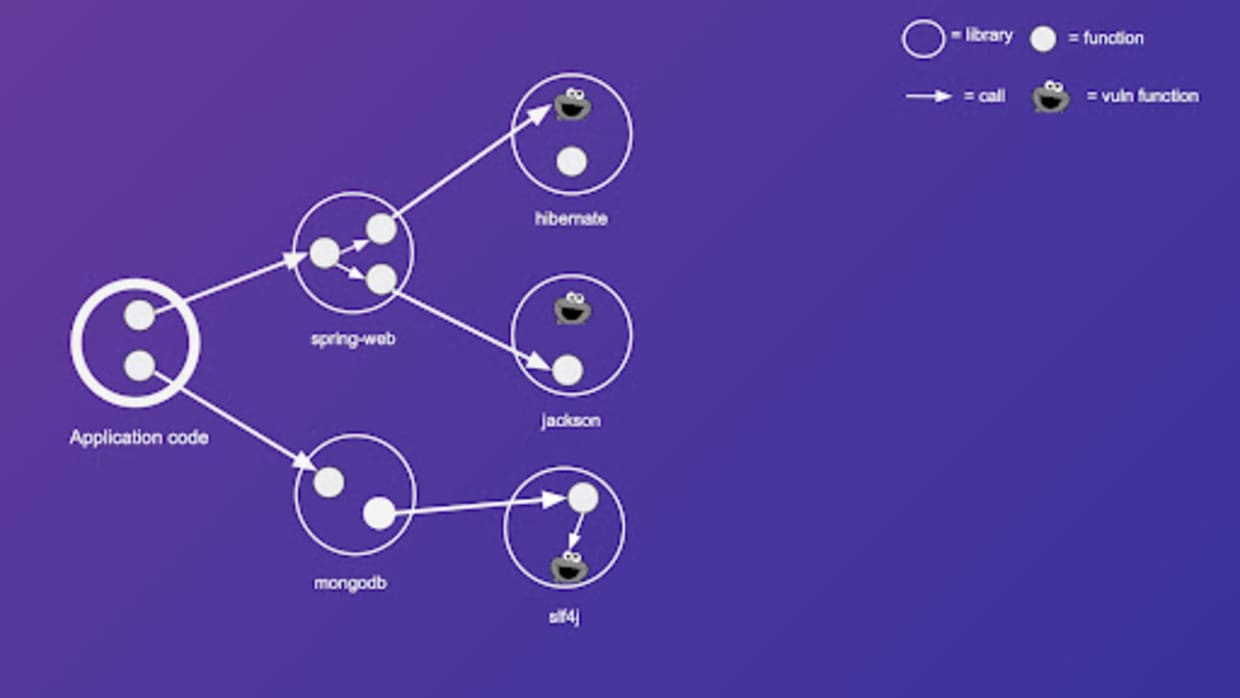
Finally, let's define a simple reachability rule over our call graph—we say that a function X is reachable from the application code if, and only if, there is a path in the call graph which starts at any node of the application code and ends at function X. Following this rule, we color all reachable functions as red, and unreachable function as green.
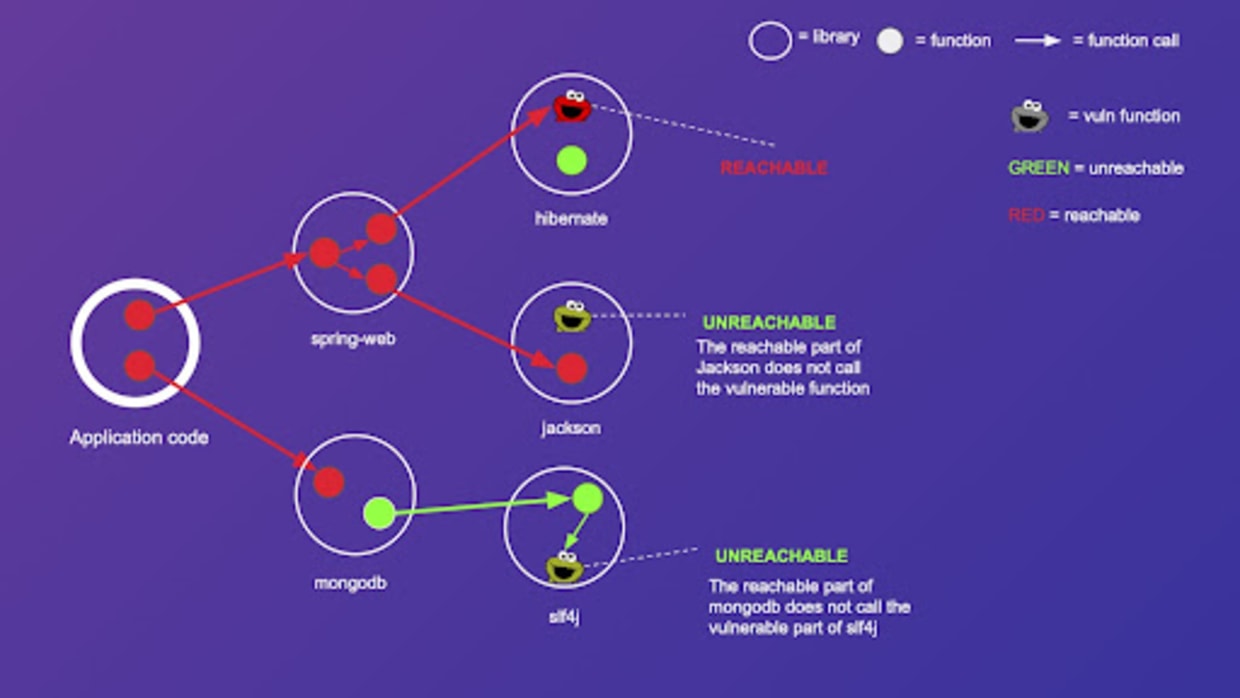
As we can see, some cookie monsters (vulnerable functions) are reachable, and some are not. This allows us to create a prioritization rule for the third party vulnerabilities of our app. If at least one vulnerable function associated with a given vulnerability is reachable, we prioritize fixing such vulnerability. On the other hand, if no vulnerable functions associated with that vulnerability are reachable, we can deprioritize fixing such vulnerability.
So, we have defined what the call graph reachability analysis is, and how it can help us with prioritizing vulnerabilities. But how do we actually compute the call graph?
Let's run the app to get the call graph
One thing you can do to get the call graph is to run the app and collect data on functions' execution using a runtime agent. But this dynamic (runtime) solution is not ideal.
Firstly, it happens "too late" in the SDLC process, because it requires access to a running application, and developers always prefer to identify and fix reachable vulnerabilities before they are merged into the main branch or pushed to production. Secondly, setting up runtime agents usually requires custom configuration for each application, which is a lot of work. Finally, developers feel reluctant to supplement their apps with such agents, because they fear such supplementations might cause outages or performance degradations.
This led us to a better solution which addresses all of the problems of a dynamic approach—static code analysis.
Computing call graph statically
Unlike a runtime (dynamic) solution, static analysis does not involve executing the program to gather information. Instead, we perform the analysis on the source code of the application. We write an algorithm to reason about program variables, assignments, function calls, pointers, etc, and derive the call graph based on that reasoning.
In fact, in the security world, static analysis is already fairly well-known, mainly due to Static Application Security Testing (SAST). The aim of SAST is to find security issues in your application code, for example, SQL injection.
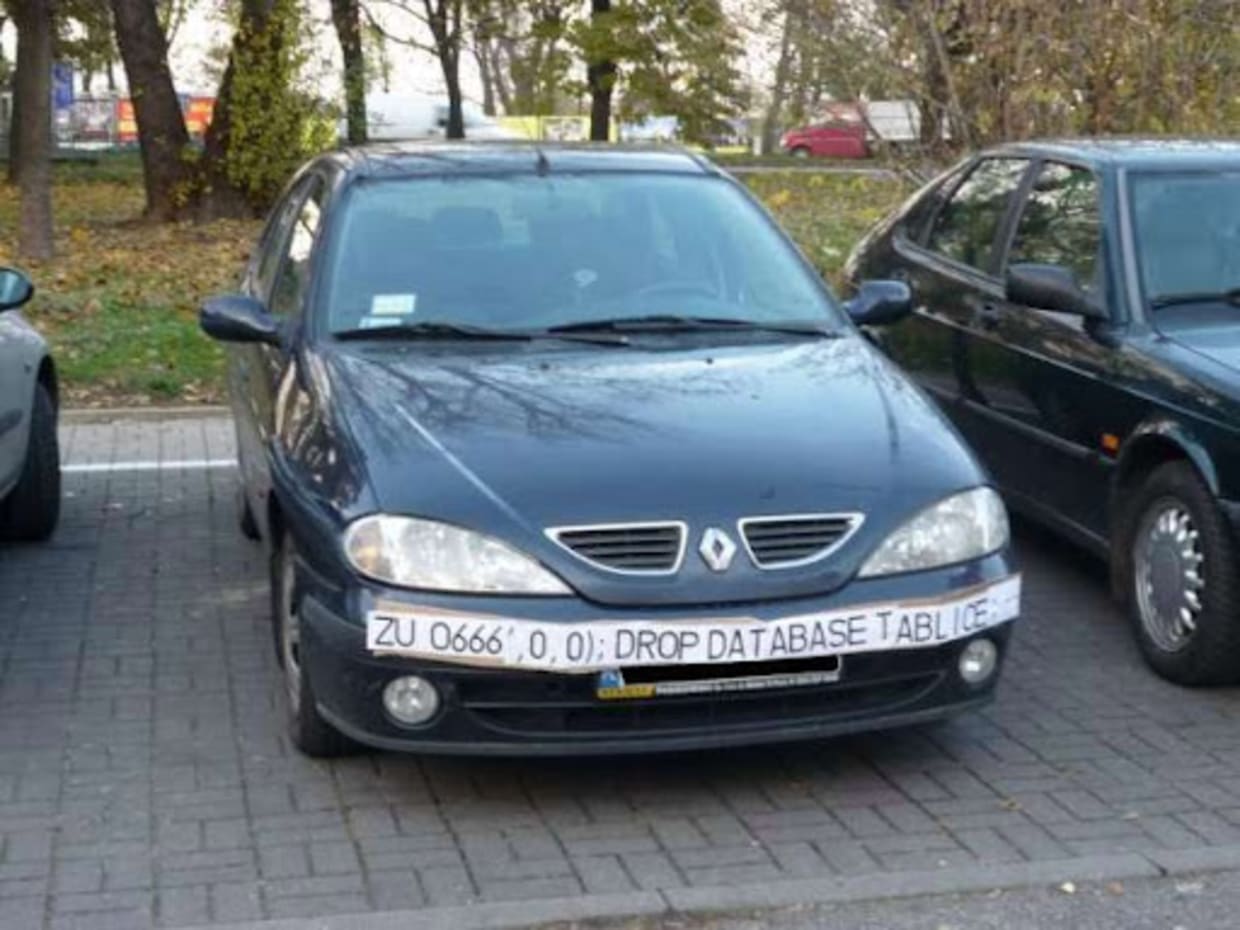
Source: posted by a Polish prankster, probably never worked in practice
Remember that our case is different from SAST. We are not uncovering security holes in your own code. We are dealing with security holes in your third-party dependencies.
Ok, so we take a program (source code) and all its dependencies (their source code) as input, and we output a call graph. Sounds straightforward, right?
Alas—static analysis is not easy, and although it is a thriving research field, analyzing real-world programs is still, to some extent, an unsolved problem for most programming languages. Take Java as an example—Java might seem like an easy language to analyze—it is strongly typed, and not very dynamic in nature (compared to, say, Javascript). So let's have a closer look at how call graph creation using static analysis can be achieved for Java programs, and what are the challenges.
Static analysis challenge number 1 — dynamic dispatch
Dynamic dispatch occurs when the correct method to be executed is selected only at runtime and is determined by the context of the execution. It is present in the vast majority of programming languages—from object-oriented, like Java (polymorphism), to functional, like Haskell (higher-order functions and closures). Dynamic dispatch is a challenge for static analysis because the analysis has to model the context which determines which functions would get invoked at runtime.
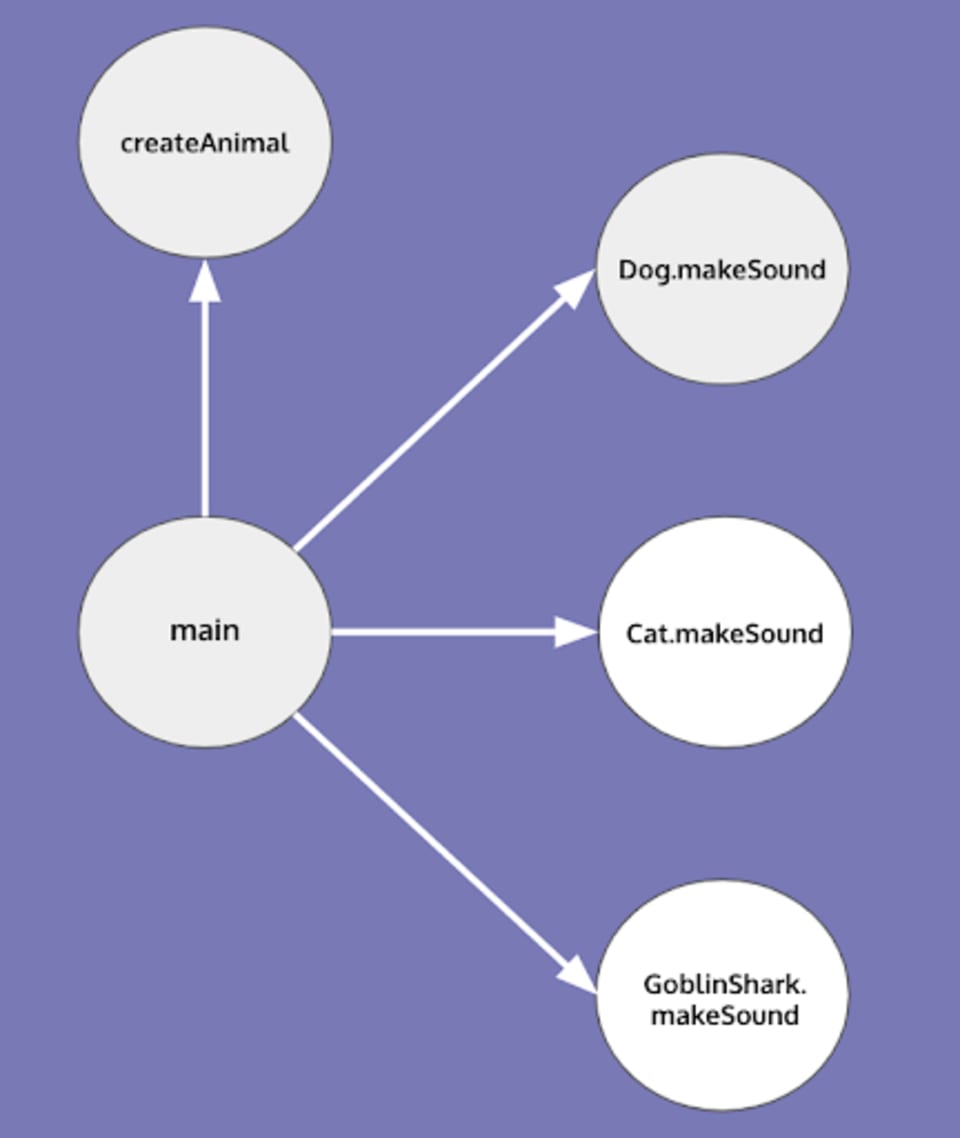
Consider the following Java example. Let's assume we have an interface Animal with one method makeSound and three classes implementing that interface—Dog, Cat, and GoblinShark. Let's consider the simple program below.
By looking at just this method (i.e. not considering the code of createAnimal()), we are unable to decide whether an animal is a Dog or a Cat or, maybe, a GoblinShark.
One way to deal with this situation is to assume all possibilities. Actually, there is a call graph creation algorithm which does just that—it is called the Class Hierarchy Analysis (CHA). For the example above, CHA would produce the following call graph:
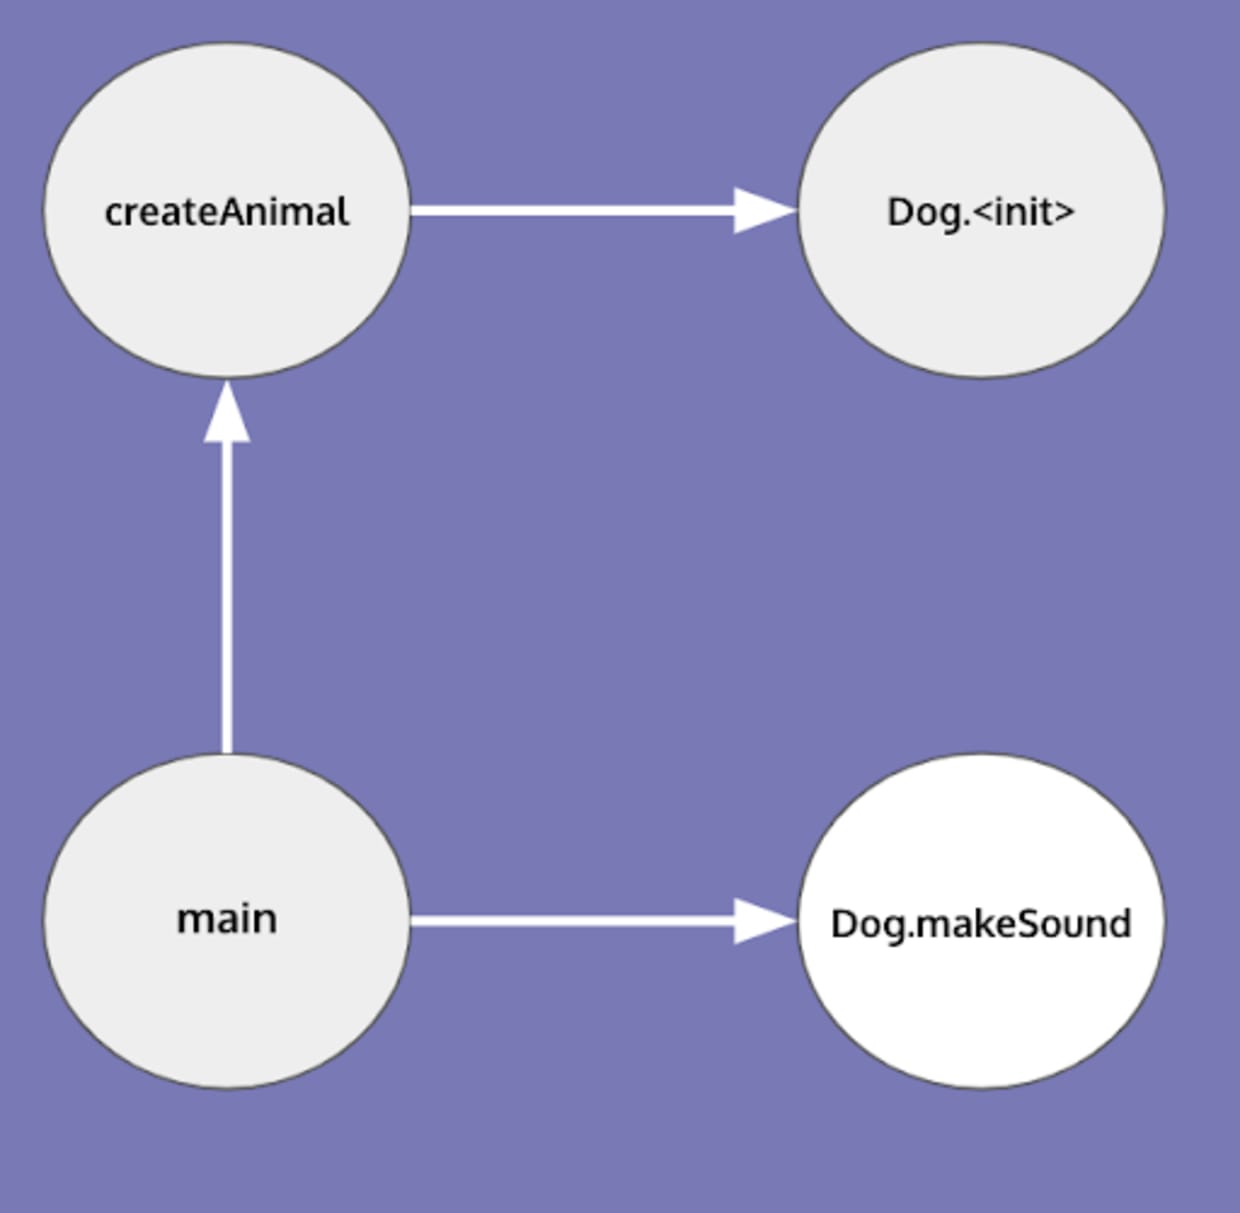
This call graph is sound, but might not be precise. For example, let's now consider the previously omitted createAnimal function, which, it turns out, creates only dogs.
Since CHA assumes all possibilities, its call graph doesn’t change and it is imprecise. The analysis which solves this problem is called points-to analysis and requires keeping track of possible values a given reference points to.
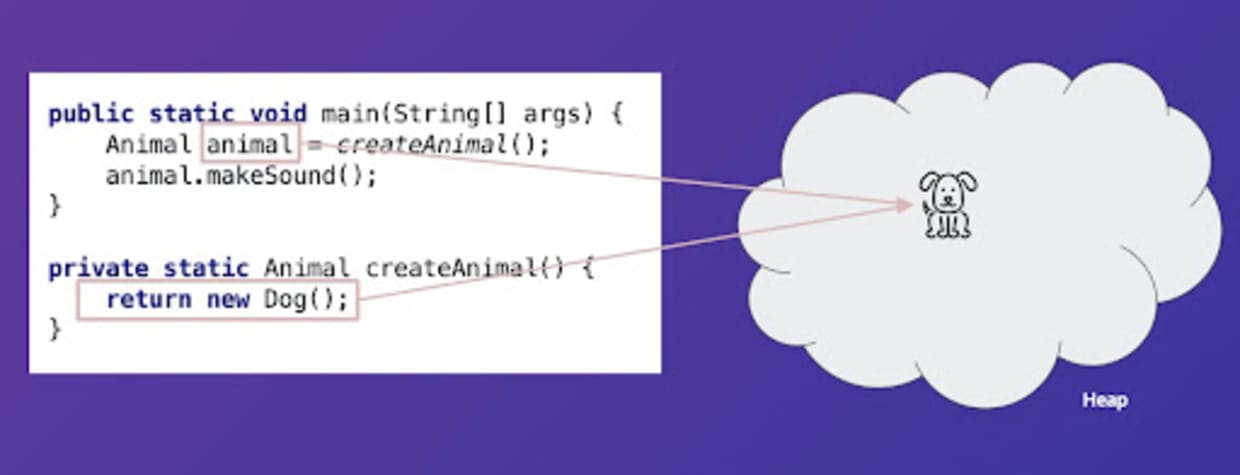
Andersen's points-to analysis is an example of an analysis which achieves the above. A call graph creation algorithm that employs Andersen's points-to-analysis would produce the following output.
Control flow
Tracking pointers is even harder when we consider the control flow of the program. Consider the simplest case:
In the above program, a dog is never making any sounds. But, for static analysis to successfully determine that it has to take into account the order of instructions. For simple programs such as the one above, we can employ an old compilers' trick and put the code into the static single assignment form (SSA). The requirement of SSA is that every variable in the program is assigned exactly once, and so the above problem would go away.
But, in general, the order of instructions does influence the state of the program, and so can influence the call graph. For example, a common pattern is to call some init function on a third party library before invoking public methods of that library.
The init method can set up some complex internal state. Consequently, the call graph for the above program could be vastly different than the call graph of the below.
Another important thing to consider are control flow statements, i.e. if, while, for, switch etc. Consider the program:
Here, a reasonable thing to do is to ignore the condition statement and assume both branches of the if statement are reachable. Because of this branching, in reality, points-to analysis tracks a set of possible pointed-to values for each variable in the program, instead of tracking just one.
Other considerations
There are many more challenges involved in creating call graphs for modern programming languages, the examples given above barely scratch the actual problem space. Other challenges involve:
Collections: keeping track of what is stored at which index within a collection.
Analyzing public methods of a library: in languages like Java, libraries' public methods often take interfaces as inputs to allow clients to customize functionality, which makes points-to analysis hard for such methods.
Dynamic code execution: a very popular pattern, especially for frameworks, is to construct the name of the function at runtime, store it as a string value, and use a special library which takes the name of the function as input and executes that function (e.g. reflection in Java).
In practice, when you use static analysis, you need to explicitly decide what you want to support because supporting everything would be computationally infeasible. In other words, applications of static analysis are always a trade-off between precision and computational feasibility (time and resources needed to compute the answer). For example, for the call graph reachability analysis of Java programs, a possible trade-off would be to run a standard Andersen's points-to-analysis with SSA, always assume all branches of conditionals (e.g. if statements), analyze all collections as if they were bags (indices don't matter), and ignore dynamic code execution (except in popular frameworks such as Spring).
Conclusion
In this blog post, we have shown how we can identify reachable vulnerabilities through a combination of expert security research and automated static analysis. The output of such analysis is always an approximation of reality. But, it is a useful approximation, especially when you are a developer trying to identify vulnerabilities that have the highest probability of being an immediate risk to your business.
At Snyk, we do everything we can to help developers tackle their security problems. Recently, we have released a number of features aimed at helping developers deal with the prioritization of vulnerabilities. Assessing the reachability of vulnerabilities is one of those features. To discover how to use it, check out the release announcement here.
Stay safe and stay secure!
Get started in capture the flag
Learn how to solve capture the flag challenges by watching our virtual 101 workshop on demand.