JVM Ecosystem report 2018 - About your Tools
October 17, 2018
0 mins readWelcome to the largest survey ever of Java developers. The data presented in the following report was taken from more than 10,200 questionnaires. If you were one of those survey-takers, many thanks to you for putting aside the time to share your experience for the benefit of others.This report is split into four posts:
JVM Ecosystem report 2018 - About your Tools
JVM Ecosystem report 2018 - About your Platform and Application
We also have a lovely handcrafted pdf report which contains all of this information in one downloadable place.
DOWNLOAD THE JVM ECOSYSTEM 2018 REPORT!
About your Tools
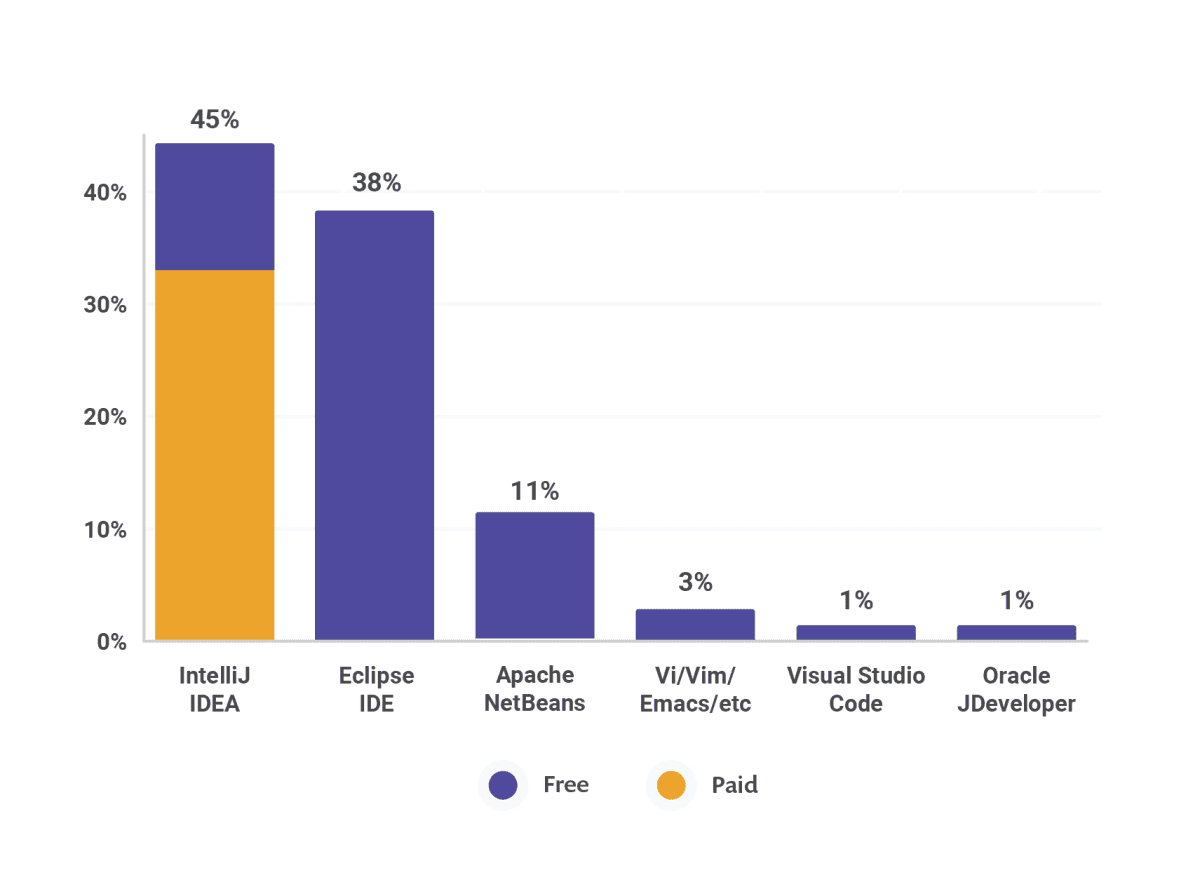
6. Which IDE do you develop with?
The graph here is consistent with other recent surveys: IntelliJ passing Eclipse in the last one to two years, and Apache NetBeans staying at around 10% of the market. The 45% total votes of IntelliJ consist of 32% IntelliJ IDEA Ultimate Edition (the paid version), 11% IntelliJ Community Edition (the free version), and 2% Android Studio users. The Eclipse category includes Eclipse STS, JBoss tools, Rational Application Developer and other Eclipse-based tools.The numbers of Apache NetBeans users haven’t altered much which suggests that the migration from Oracle to the Apache Software Foundation hasn’t affected its user base. It’s also worth mentioning that Visual Studio Code has made an appearance, which although is only 1%, shows it’s starting to make its mark in the Java community. Also, a tip of the hat to the ‘vi/vim/emacs/etc’ group who are probably reading this report on a tablet (carved out of stone).
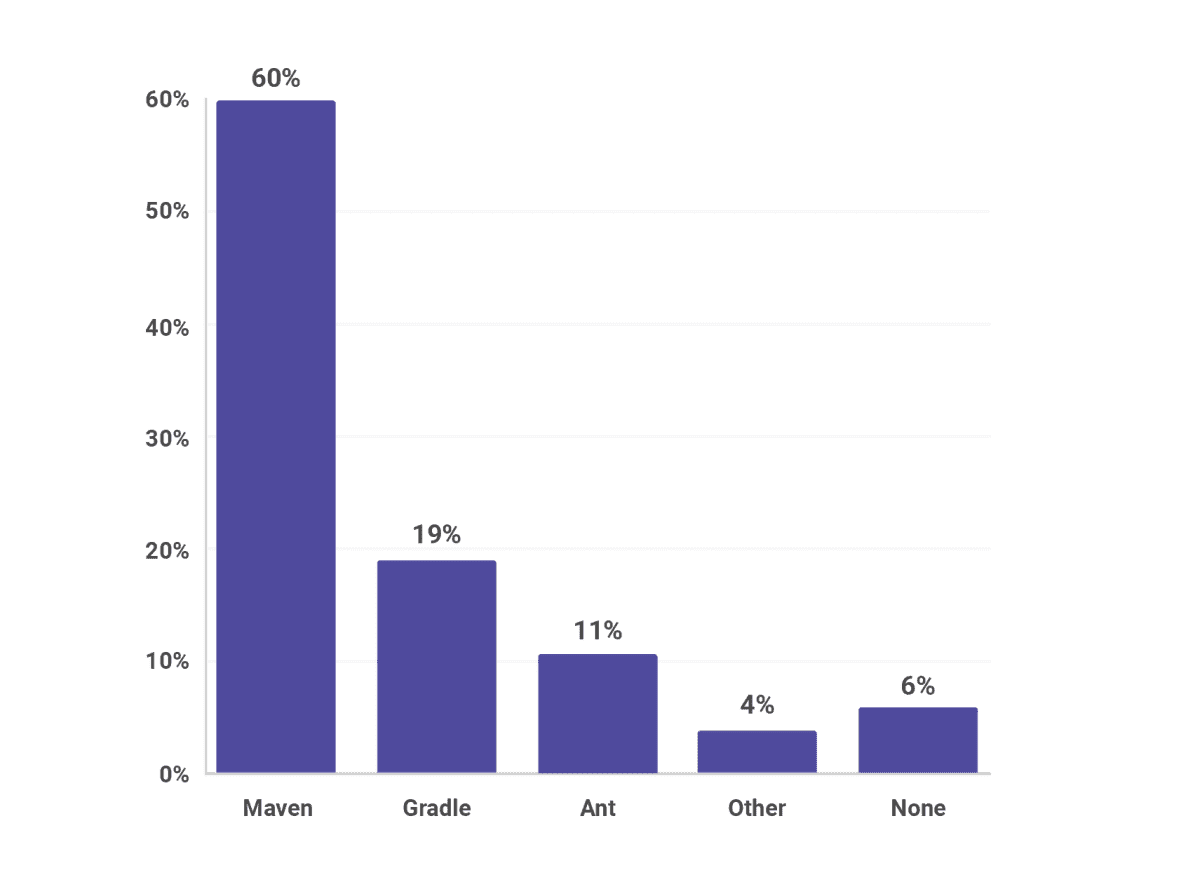
7. Which build tool do you use for your main project?
In examining the numbers, it’s important to note that we asked for the _principal_build tool used. We want to know which build tool you rely on for your main project. It can also be interesting to know which build tools teams use across all their projects, but the plethora of answers tends to dilute the usefulness of the responses. As we can see here, Maven clearly dominates with a 3:1 ratio over it’s closest rival, Gradle. Ant is still in use by 1 in 10 developers, whereas 1 in 20 use nothing!In a 2016 version of a similar survey by RebelLabs (2,000 respondents), Maven stood at 68% and Gradle at 16%. Gradle’s improved adoption rate is due perhaps to the addition of support for Kotlin as the scripting language. Gradle is also the default build engine for Android projects. However, its progress against Maven has been slow.
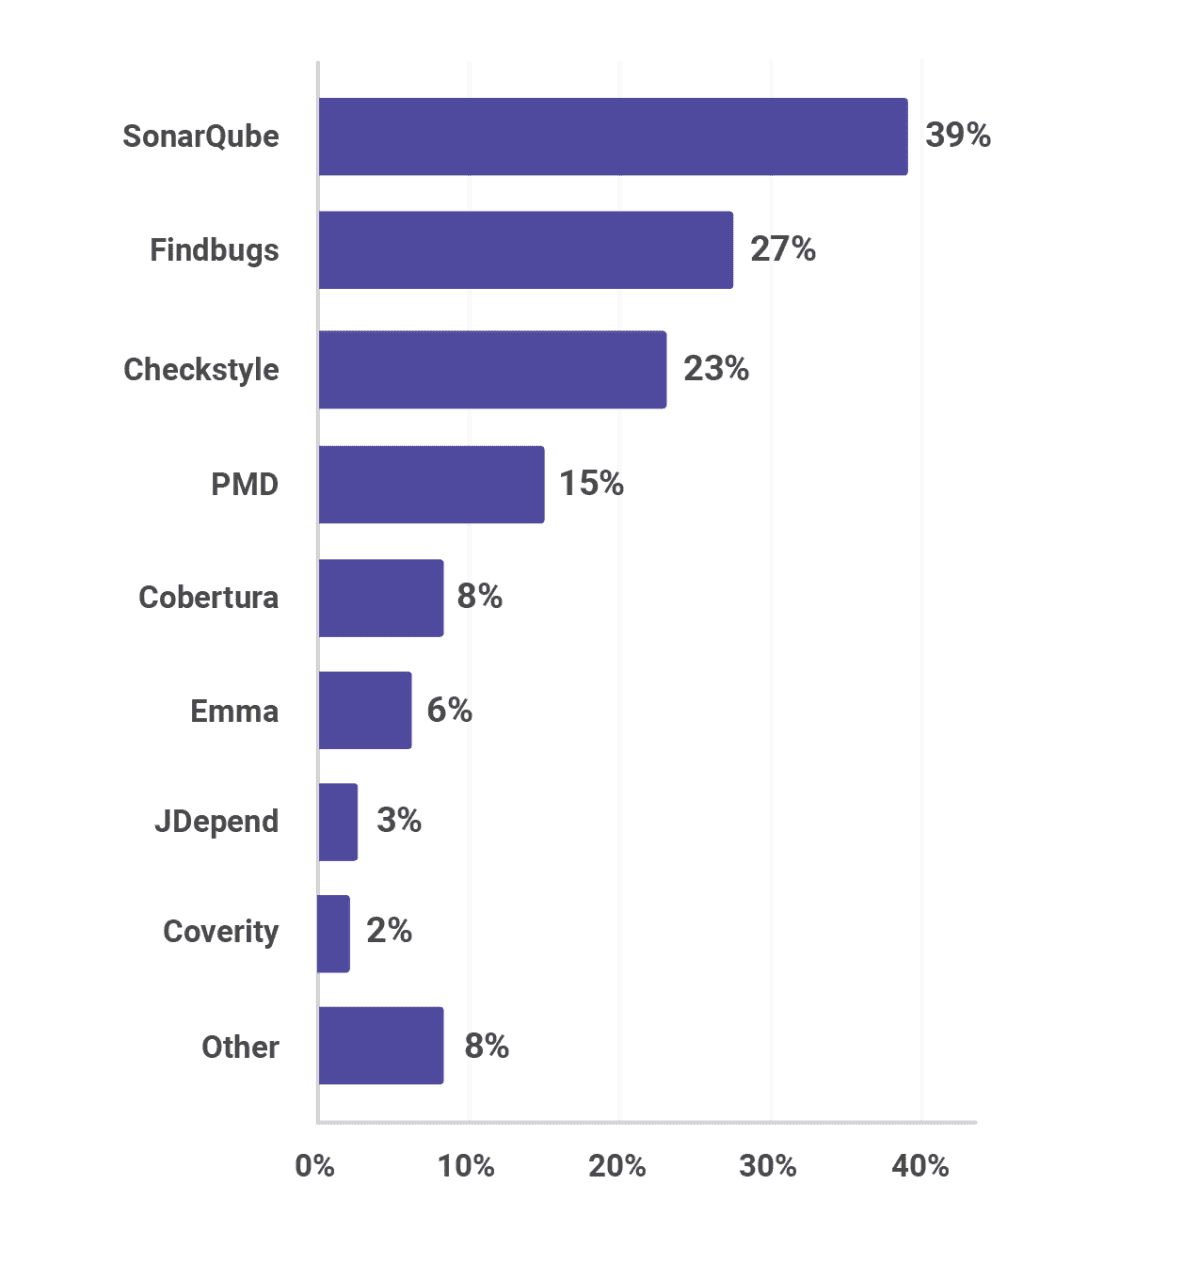
8. Which static quality tools do you use
Before you send that email or tweet trying to fix the internet, note that this is a multiple choice question so numbers here are not do not add up to 100%. One take away from this data is that there are really only a handful of static quality tools in popular use, with no real surprises at the top: SonarQube, Findbugs, and Checkstyle dominate. Possibly most surprising is that 36% of respondents don’t use any static quality tool whatsoever. This is most surprising as we expect that static quality tools are the norm.
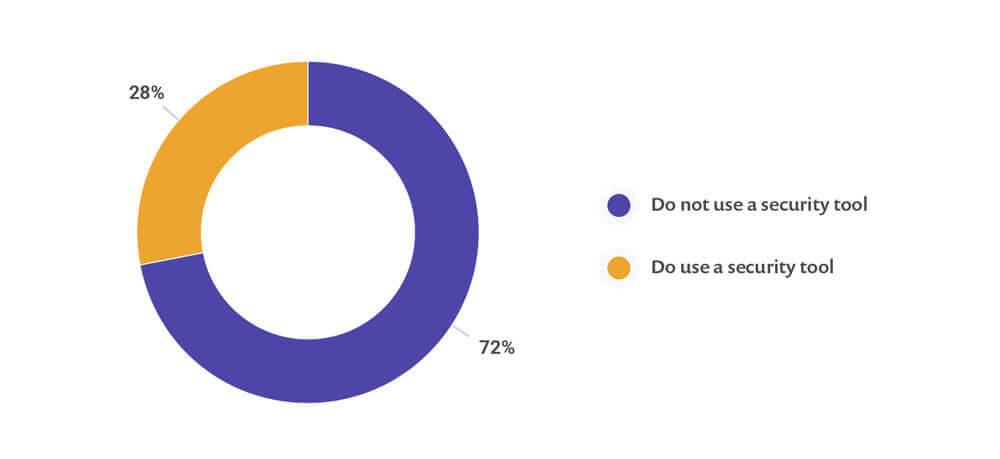
9. Do you use static security tools in your testing?
Security testing is becoming a hot topic, that is headlined by significant breaches across many different companies. Yet, still today, most sites do not use any static security tool whatsoever. In fact 72% of respondents, almost three-quarters, don’t use any static tooling anywhere in their pipeline, potentially leaving them open to known vulnerabilities. We hope a wider adoption of security tools will appear in future surveys.
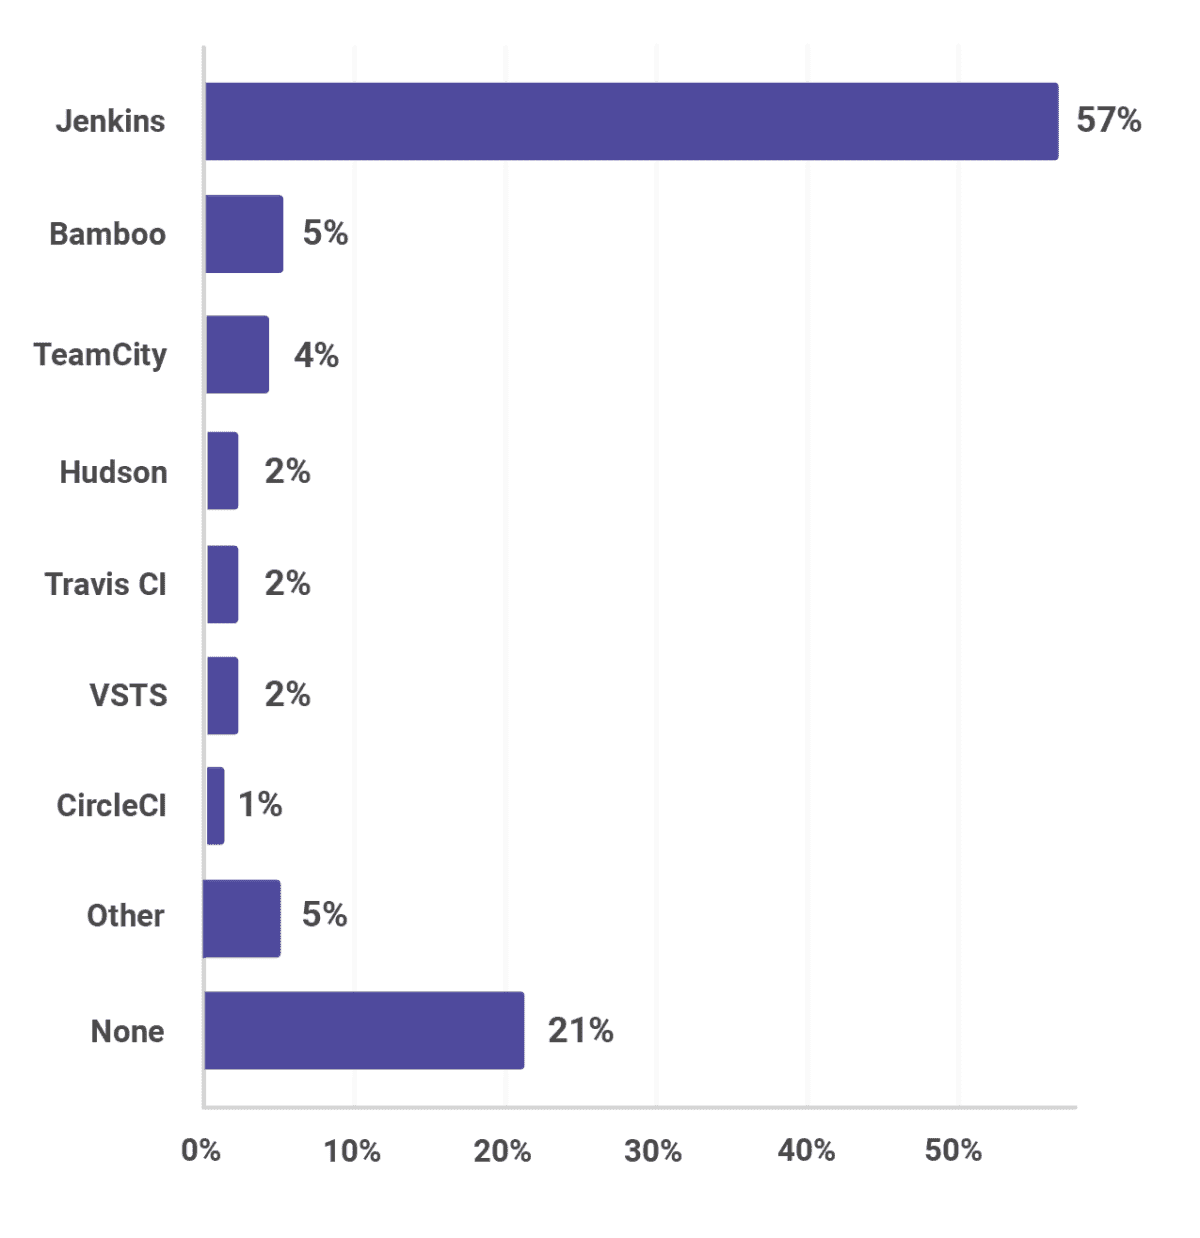
10. Which CI server do you use?
As most developers would expect, Jenkins wins the CI server race with a whopping 57% market share. It’s closest competitor is “none” at 21% of the vote, which almost matches the rest of the competition combined (at 22%). The remaining CI servers have less than 5% of the market share each, with Hudson, the elderly relative of Jenkins, struggling on at 2%. It’s worth mentioning VSTS, Microsoft VSTS (Visual Studio Team Server), which is not usually thought of in the Java/JVM space, clocks in at 2%.Most developers, we believe, expect that nearly all sites today use continuous integration. So, it’s startling to see that 1 in 5 applications do none at all. Even personal projects today use CI (such as Travis CI and CircleCI), which are made available on public project-hosting sites such as Bitbucket and GitHub. If you’re one of the 21% who don’t use CI on your projects, we’d love to hear why.
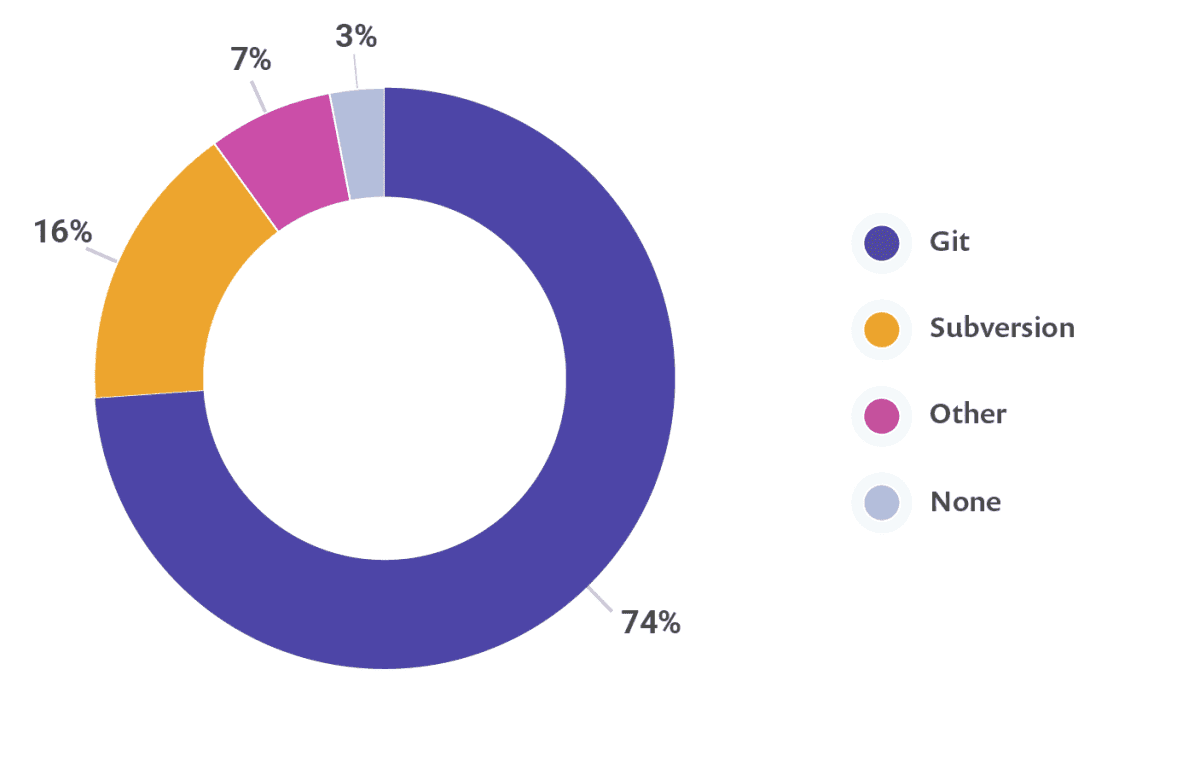
11. Which source code management platform does your team use for your main project?
As expected, Git has convincingly won the horse race in source code management. If you were in any doubt as to the extent of its dominance, almost 3 in 4 of our respondents work in teams that use Git to manage their codebases. Subversion now covers the majority of the remaining respondents; and somehow in 2018, 3% of people still don’t use source code management whatsoever. Sometimes, there are no words.
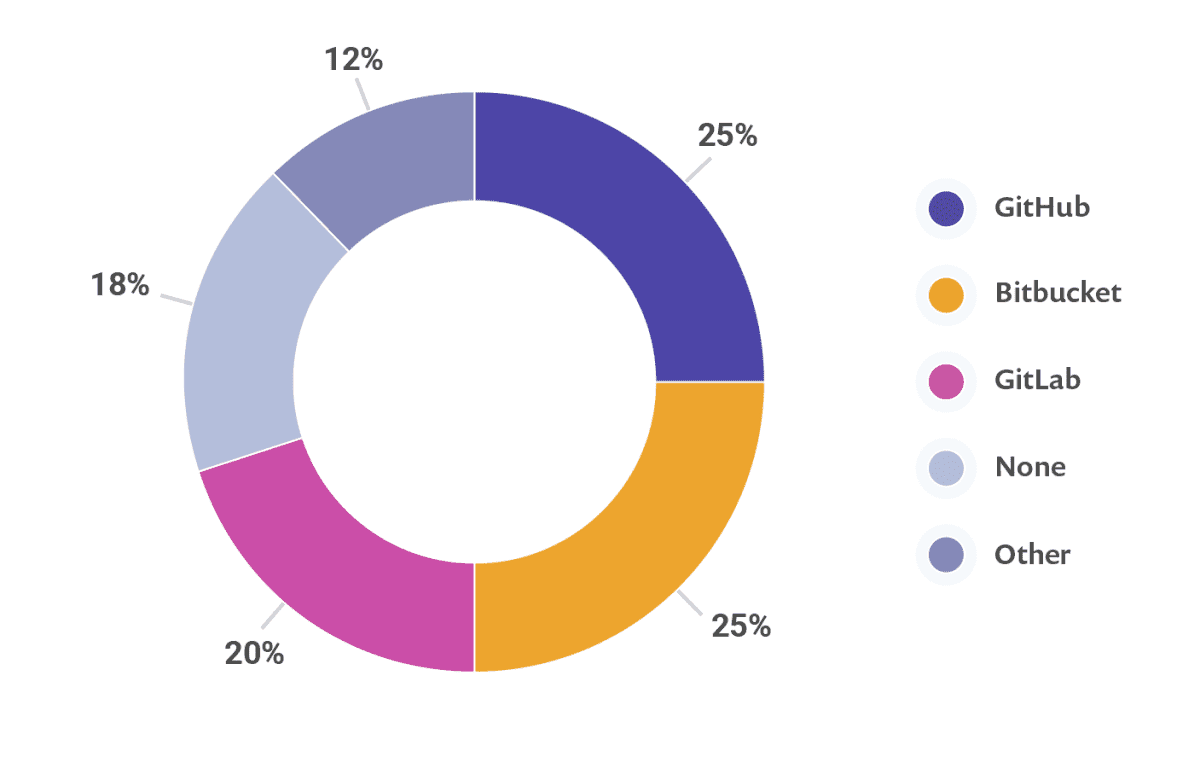
12. Which code repository do you use for your main project?
With code repositories, the story is quite different from SCM: much more spread out with GitHib and Bitbucket neck-and-neck at 25% each and GitLab close behind at 20%. We could call those, the “big three” of project hosting. Note that this question is not just for public projects (in which we expect GitHub would have a more significant lead), but also for public and private project hosting.Microsoft’s recent acquisition of GitHub might affect its future adoption rate and we’ll know more in future surveys. Of the 25% share that GitHub has, just over half (52%) of those respondents are using the public version, whereas the remainder (48%) are using the private GitHub Enterprise on-premises offering. VSTS makes up part of the “other” bracket with 2%.
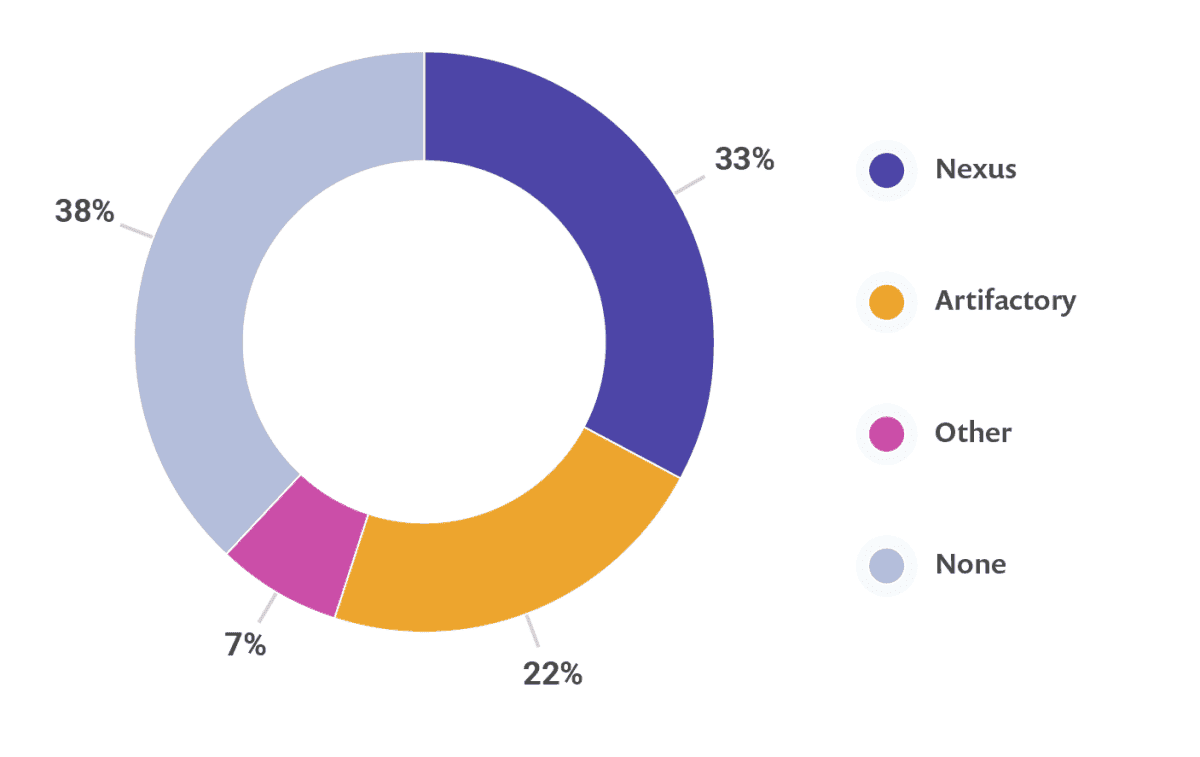
13. Which private binary/artifact repository do you use?
Most sites don’t use a packaged artifact repository--in theory because they don’t have the need. Those that like the convenience it offers choose the well established Nexus, which is heavily focused on the JVM ecosystem, followed by JFrog’s Artifactory, which is somewhat more popular across polyglot ecosystems.
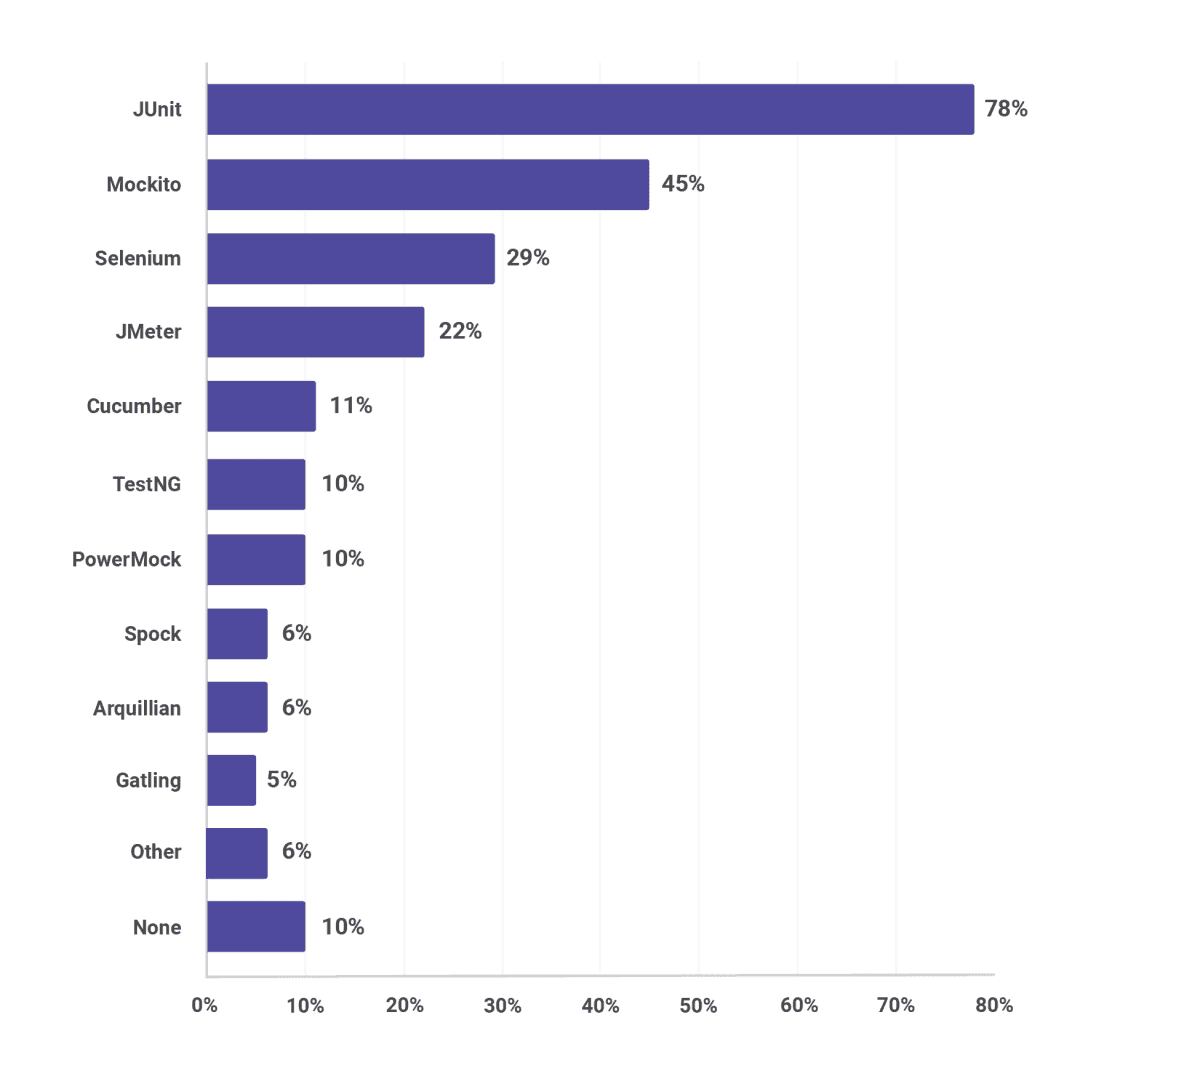
14. Which testing technologies do you use?
With an amazing (almost) 4 in 5 people using JUnit and TestNG used by 10% more, it’s clear that unit testing by far the most dominant testing practice in the JVM ecosystem. (Respondents could choose multiple answers, so totals exceed 100%.) As to mocking, it’s now clear that Mockito has emerged as the preferred mocking framework.With JMeter being used by almost 1 in 4 respondents and Gatling by 5%, we can see that the need for performance testing is becoming much better appreciated. Selenium takes an impressive 29%. Unlike the results for static quality tools, only 10% of respondents say they don’t use any testing tool whatsoever. Hang on… 1 in 10 people don’t use a testing tool?! We should move on before we lose faith in humanity.
Tools Summary
9 in 20 developers now use IntelliJ IDEA
6 in 10 developers use Maven to build their main project
Over 7 in 10 developers still don't use static security tools
Almost 6 in 10 developers use Jenkins in CI
Almost 3 in 4 developers use Git as their SCM
GitHub, BitBucket and GitLab take an almost even share of the code repository market
Almost 8 in 10 developers use JUnit
There's more to this report! Which section do you want to read next?
JVM Ecosystem report 2018 - About your Tools
JVM Ecosystem report 2018 - About your Platform and Application


