8 tips for securing your CI/CD pipeline with Snyk

2023年7月20日
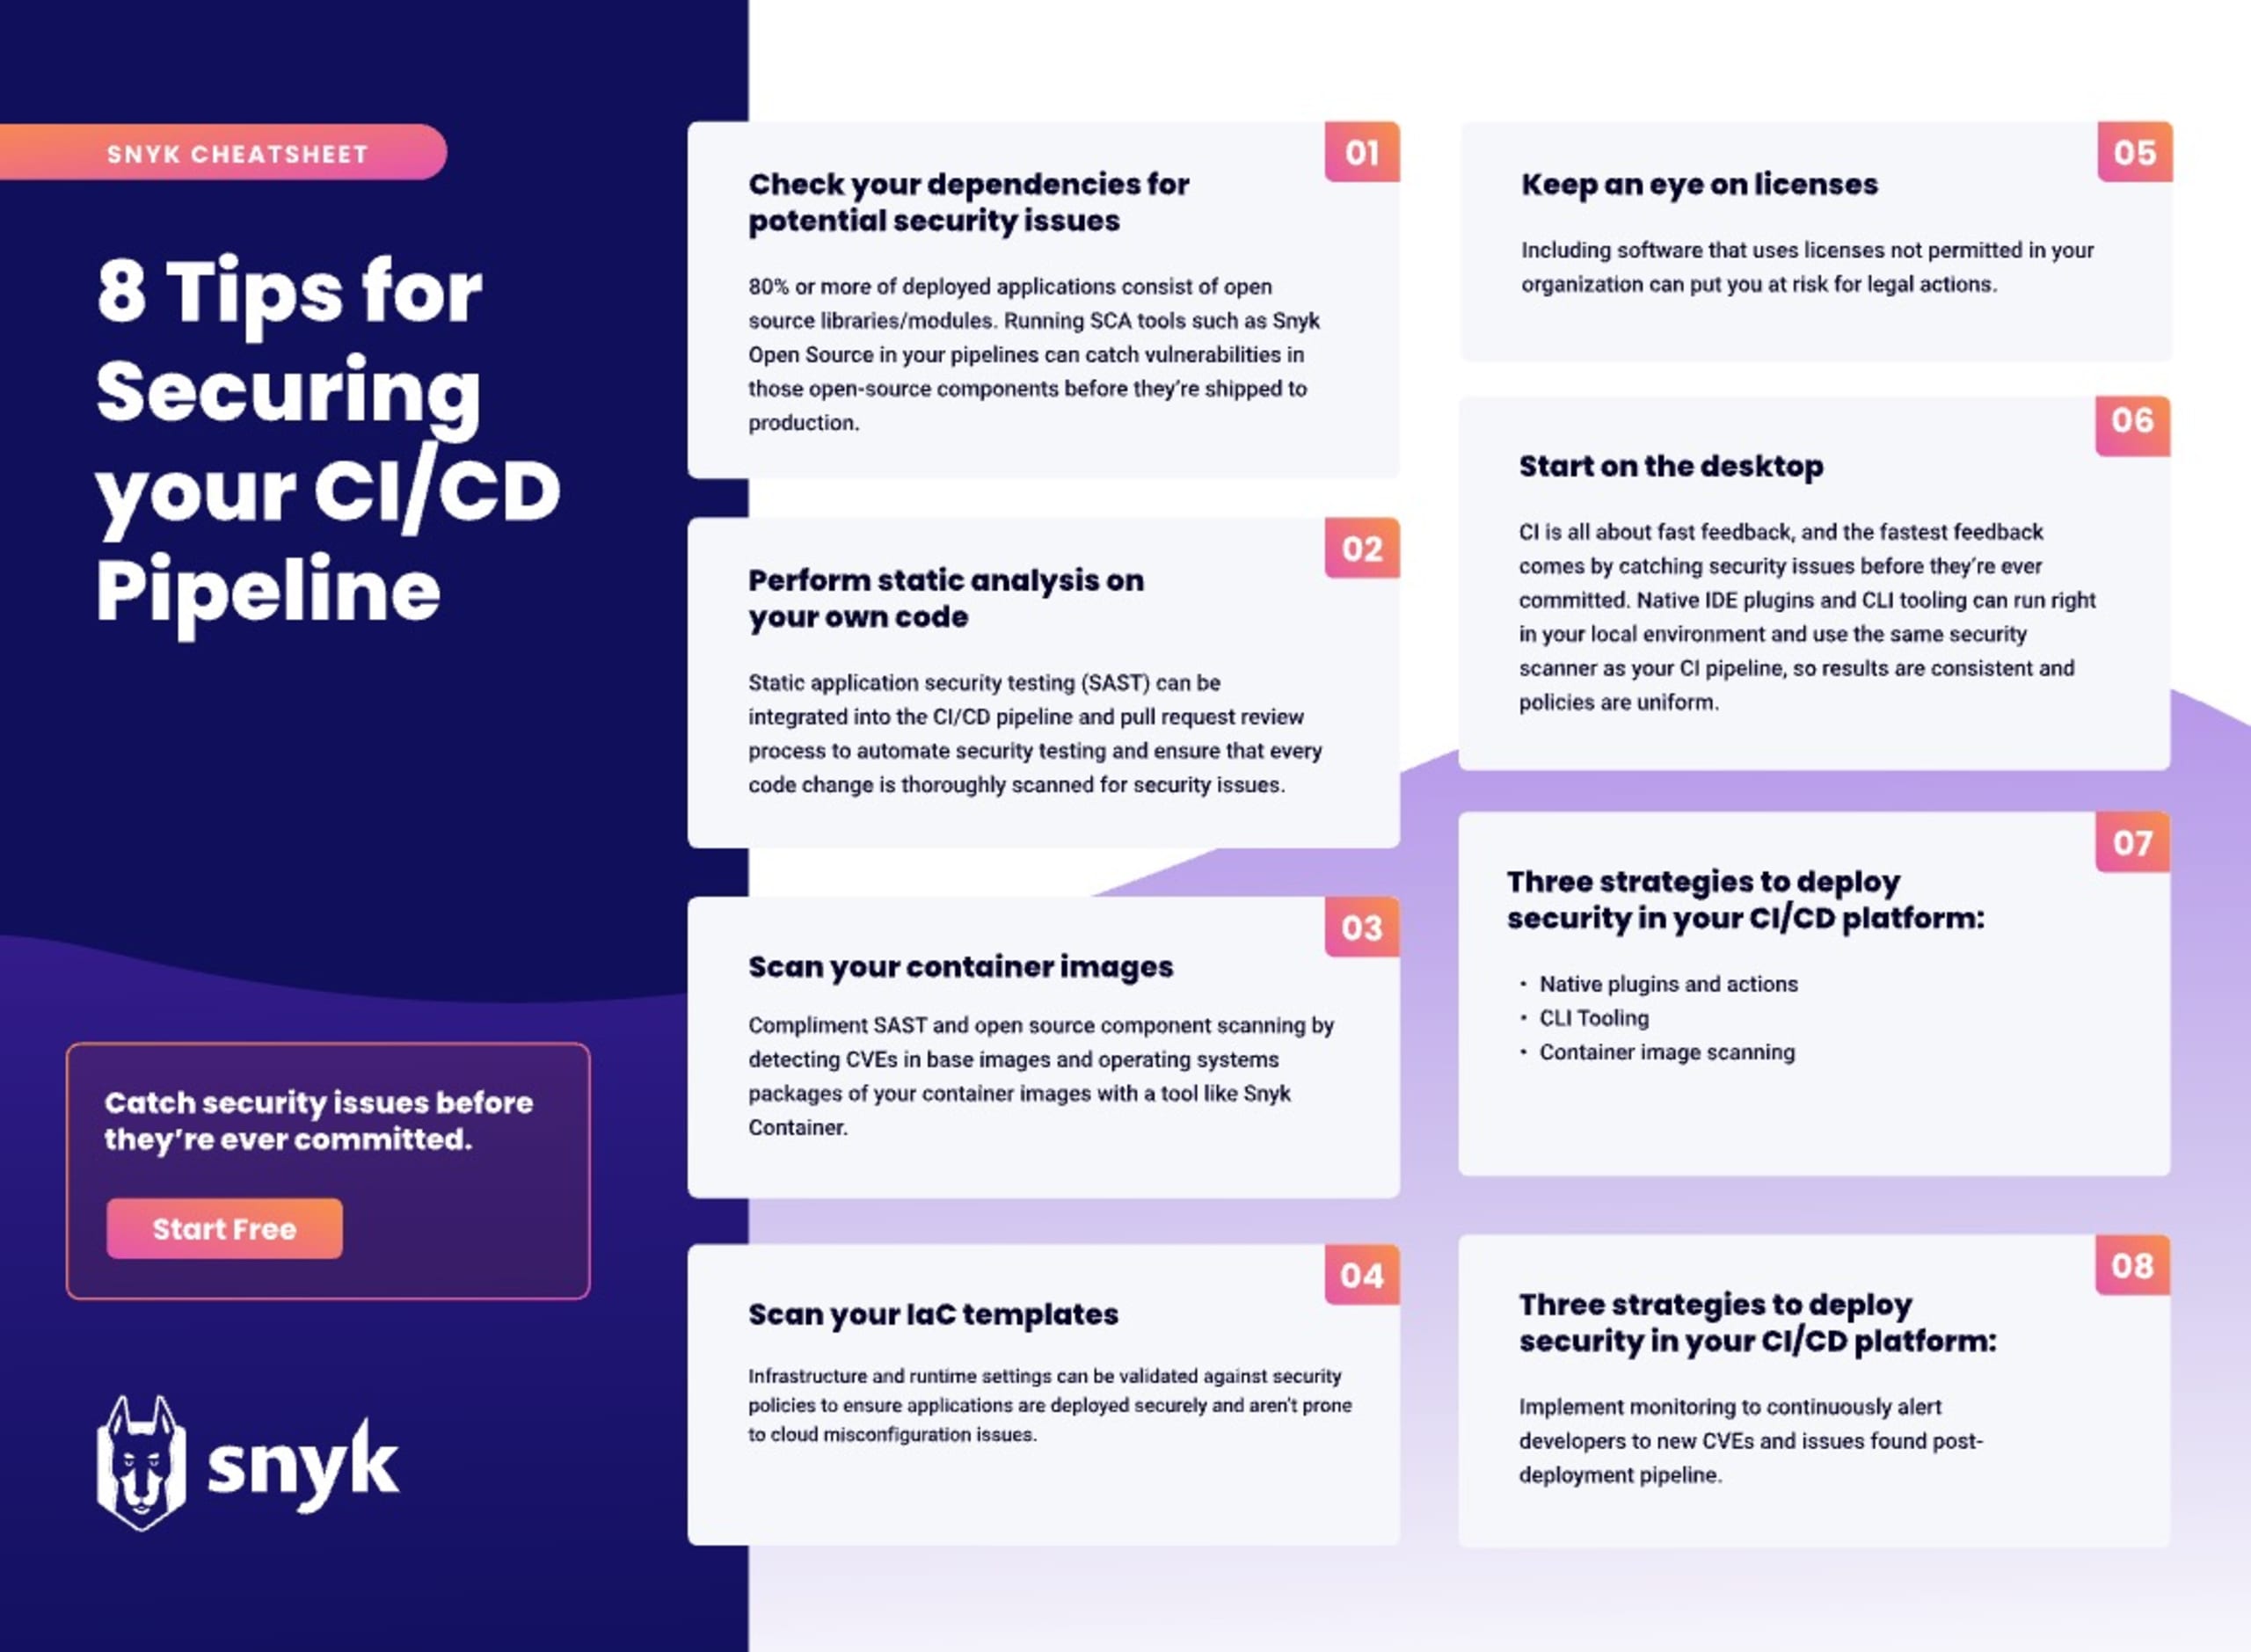
0 分で読めますSecuring your CI/CD pipeline is critical to modern application security. So, we created a cheat sheet to make the process easier. In this post, we’ll cover using Snyk in your CI/CD pipelines to catch security issues quickly and empower your developers to fix them before they get to production. Tips 1-5 cover the different kinds of scanning you can implement, and tips 6-8 will dive into implementation examples in two of the most popular CI/CD platforms in use today — Jenkins and GitHub Actions.
Download the cheat sheet today to review these tips at a glance.
While the examples in this cheat sheet focus on their implementations in Jenkins and GitHub Actions, the concepts are easily ported to other solutions.
So, let’s get started with our list of 8 tips for securing your CI/CD pipeline with Snyk
1. Check your dependencies for potential security issues
Snyk Open Source (OS) implements a software composition analysis (SCA) scanner, an application security methodology for managing open source components. Using Snyk Open Source, development teams can quickly track and analyze any open source component brought into a project and detect software licenses, deprecated dependencies, vulnerabilities, and potential exploits. When you add up all of the transitive dependencies your applications rely on, open source libraries can make up as much as 90% of what you are deploying. Using SCA scanning to alert your team to potential vulnerabilities brought in by this deep graph of dependencies is critical. Snyk Open Source not only reports on known CVEs but can also provide remediation advice to guide developers to fixes quickly. For more information on SCA scanning, check out our Guide to Software Composition Analysis, and keep reading for examples of deploying Snyk Open Source in your pipelines.
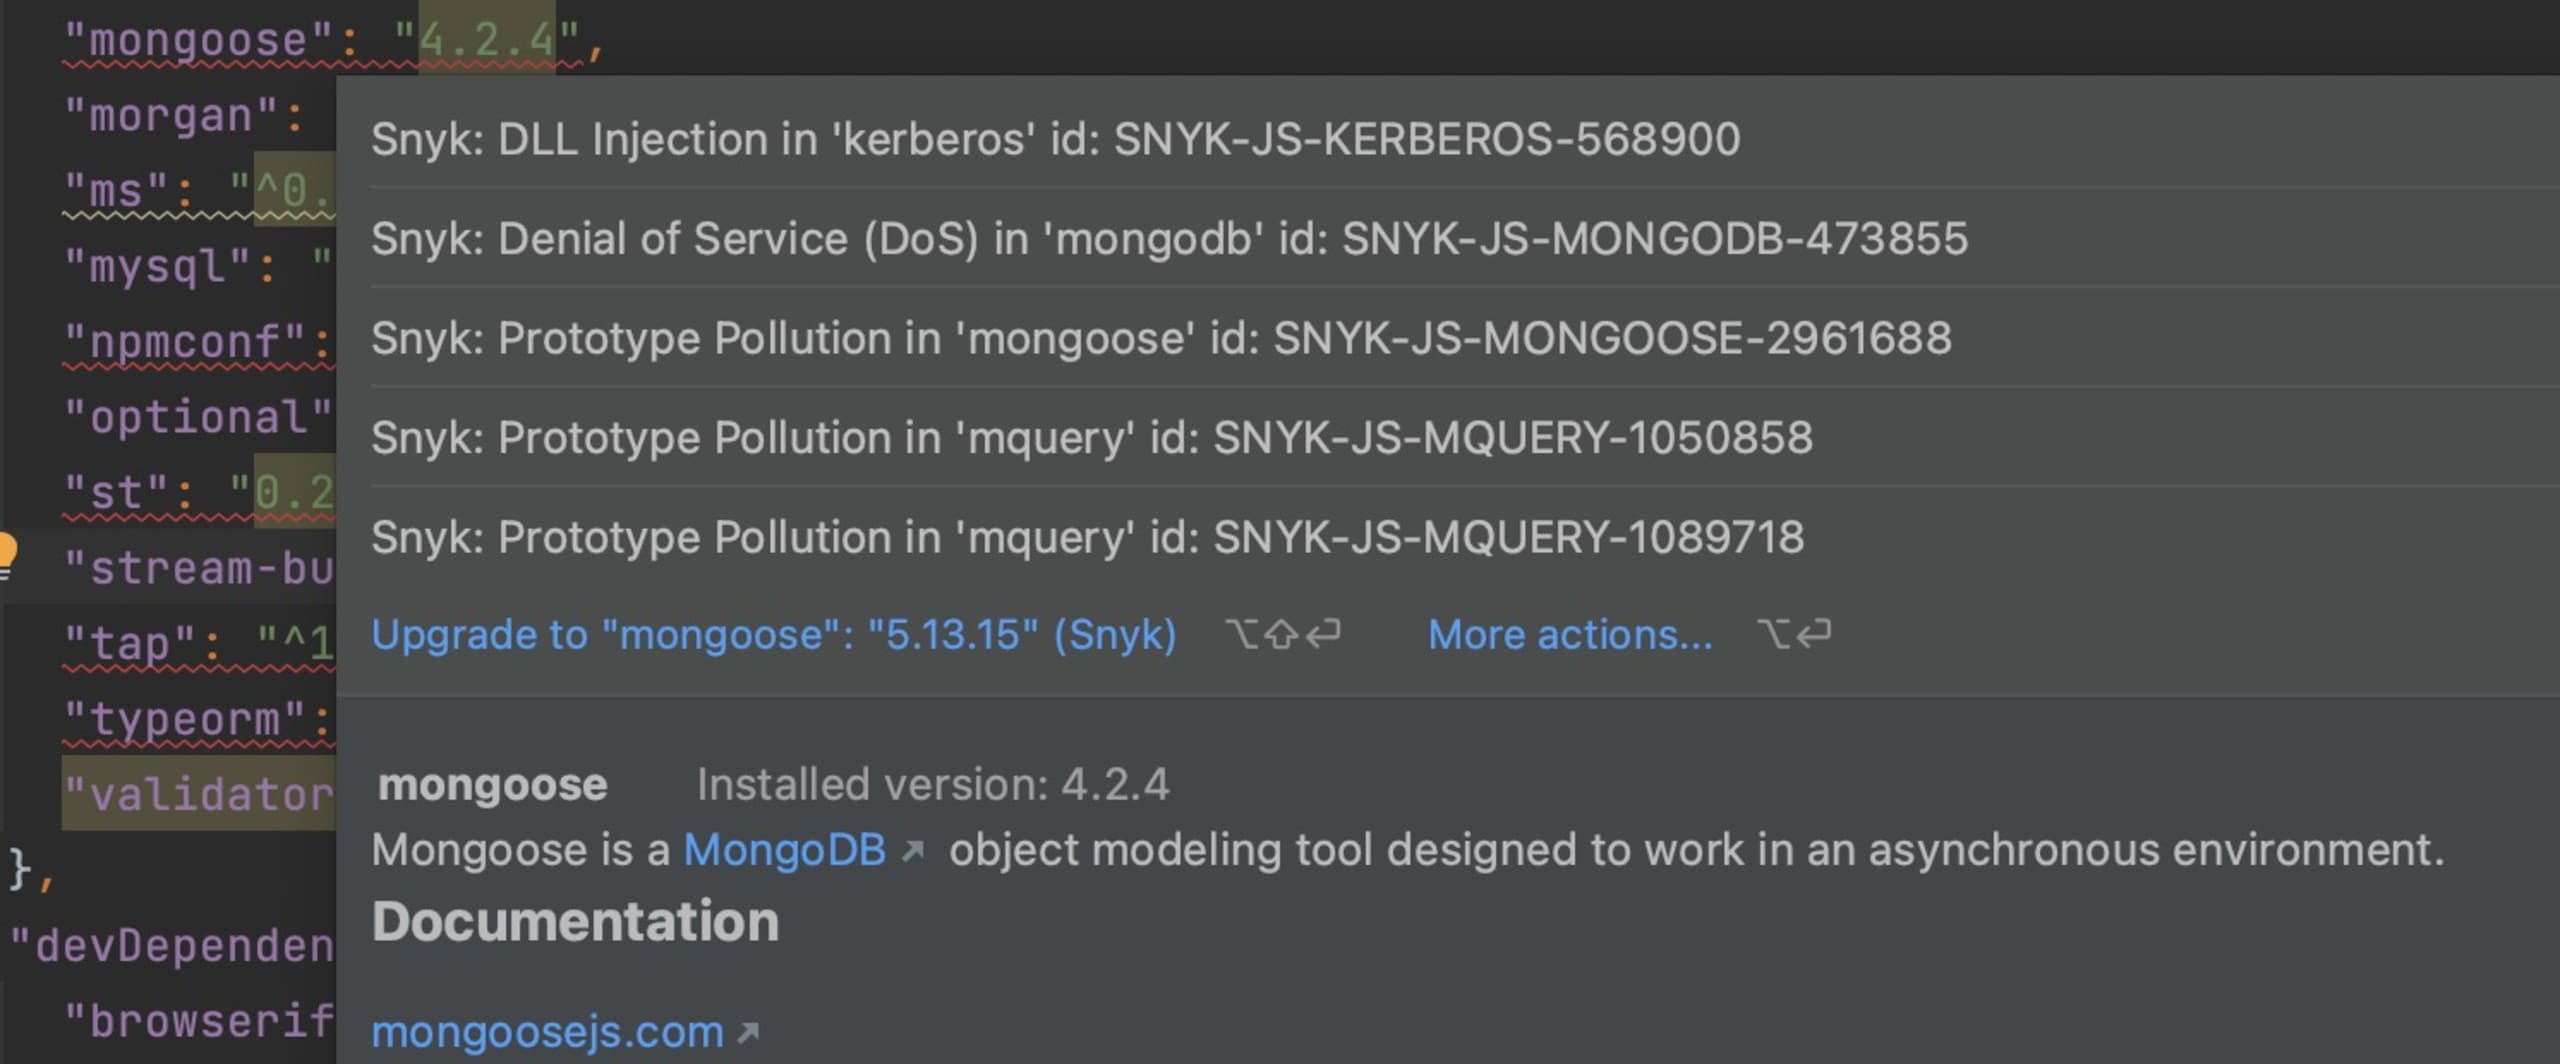
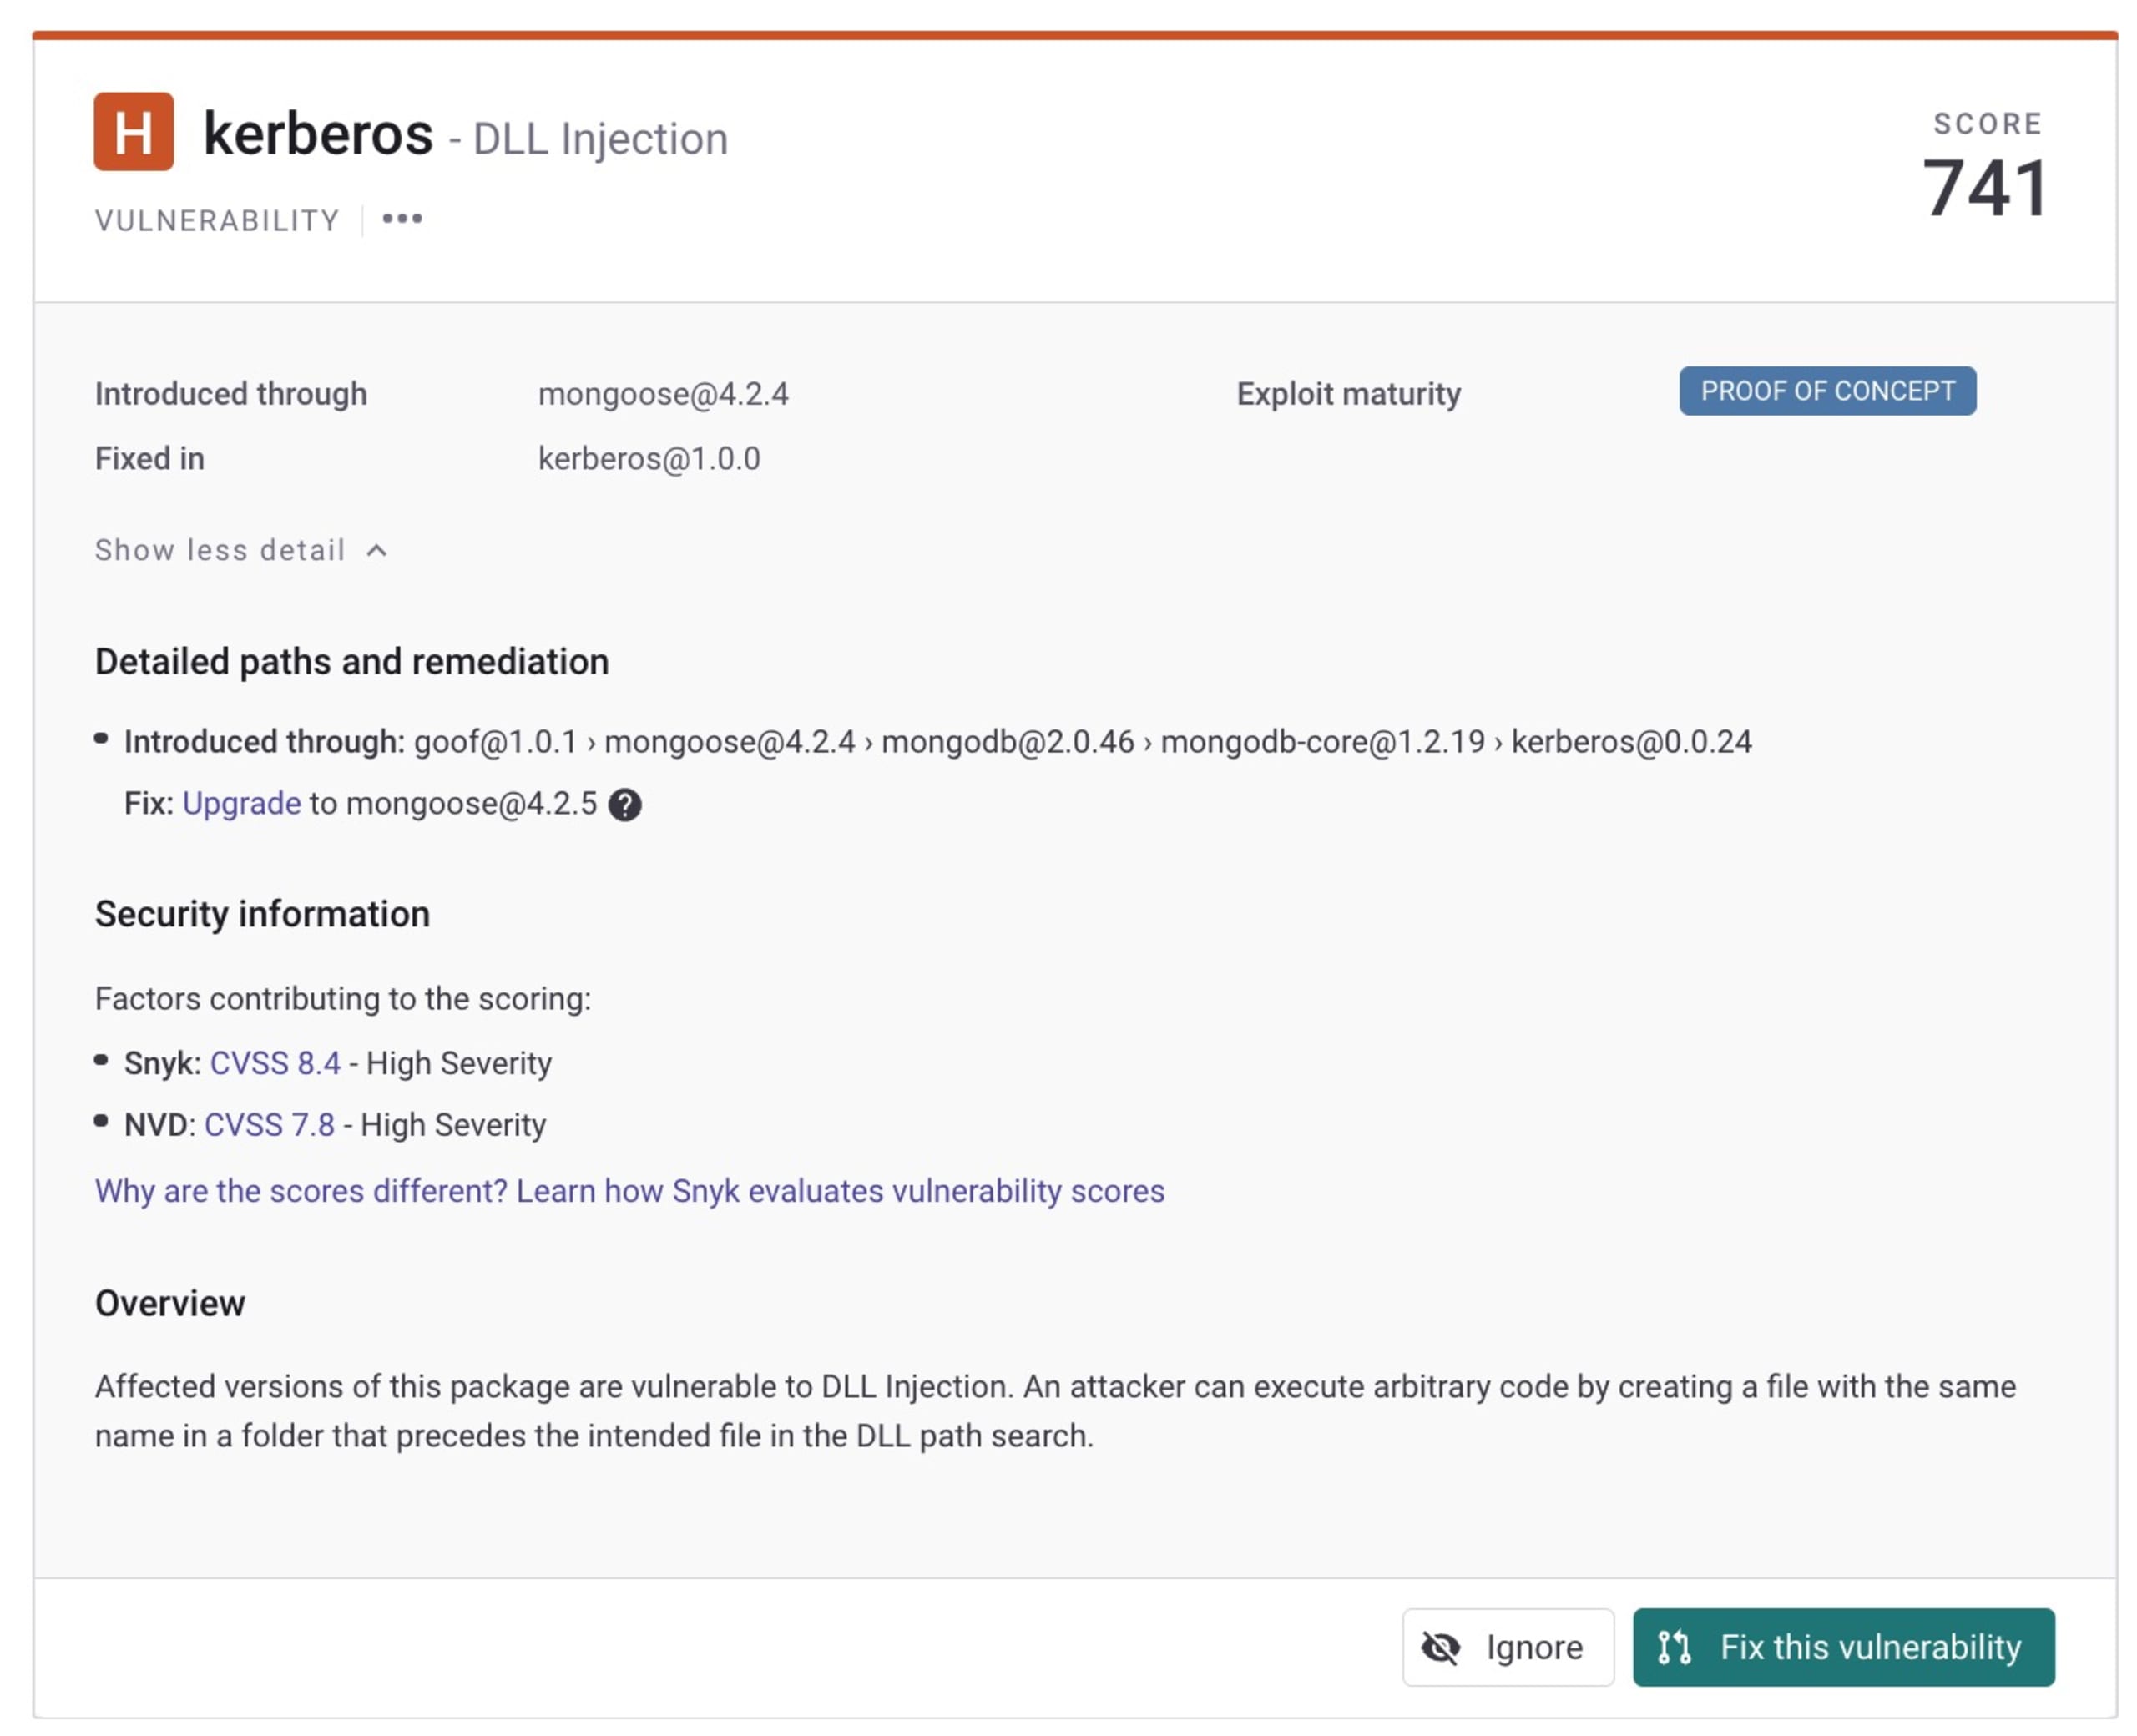
Let’s say you have a Node.js that depends on the mongoose npm module so it’s package.json file has a dependencies entry such as this — "mongoose": "4.2.4". Your team may not realize that mongoose@4.2.4 depends on kerberos@0.0.24, which has a known DLL Injection vulnerability that could allow an attacker to remotely execute malicious code on your systems. This dependency is not easily seen because it is three levels of indirection away from your package.json entry:
mongoose depends on mongodb
mongodb depends on mongodb-core
Mongodb-core depends on kerberos
The Snyk Open Source SCA scanner traverses all transitive dependencies, finds such issues, and provides remediation advice, when available, on how to remove them best. For example, the Snyk JetBrains IDE plugin will highlight the dependency and provide tool-tip vulnerability advice and automatic upgrade remediation right on the developer's desktop:
Additionally, a Snyk monitor report for this CVE shows the transitive path and other information useful to understanding the issue and how to fix it:
2. Perform static analysis on your own code
Static application security testing (SAST) involves analyzing your application's source code for vulnerabilities and security weaknesses that could be exploited by attackers. By performing SAST scans early in the SDLC pipeline, developers can identify and remediate potential security issues before they make their way into production. SAST also helps developers adhere to coding standards and best practices, reducing the likelihood of introducing security vulnerabilities in the code. By integrating SAST scanning into the CI/CD pipeline, developers can automate the security testing process and ensure that every code change is thoroughly scanned for security issues, allowing them to deliver secure and high-quality software more efficiently.
The Snyk Code SAST scanner leverages machine learning algorithms and an AI knowledge base that's continuously trained on hundreds of thousands of open source projects — combined with rich rule sets and curated content from the Snyk security engineering team — to point out security flaws in your code, as well as provide training on the nature of the issue and examples of how to resolve it. For a deeper dive into the technology behind Snyk Code, check out our blog Exploring the advanced technologies behind Snyk Code.
For example, here is a snippet from a Node.js application:
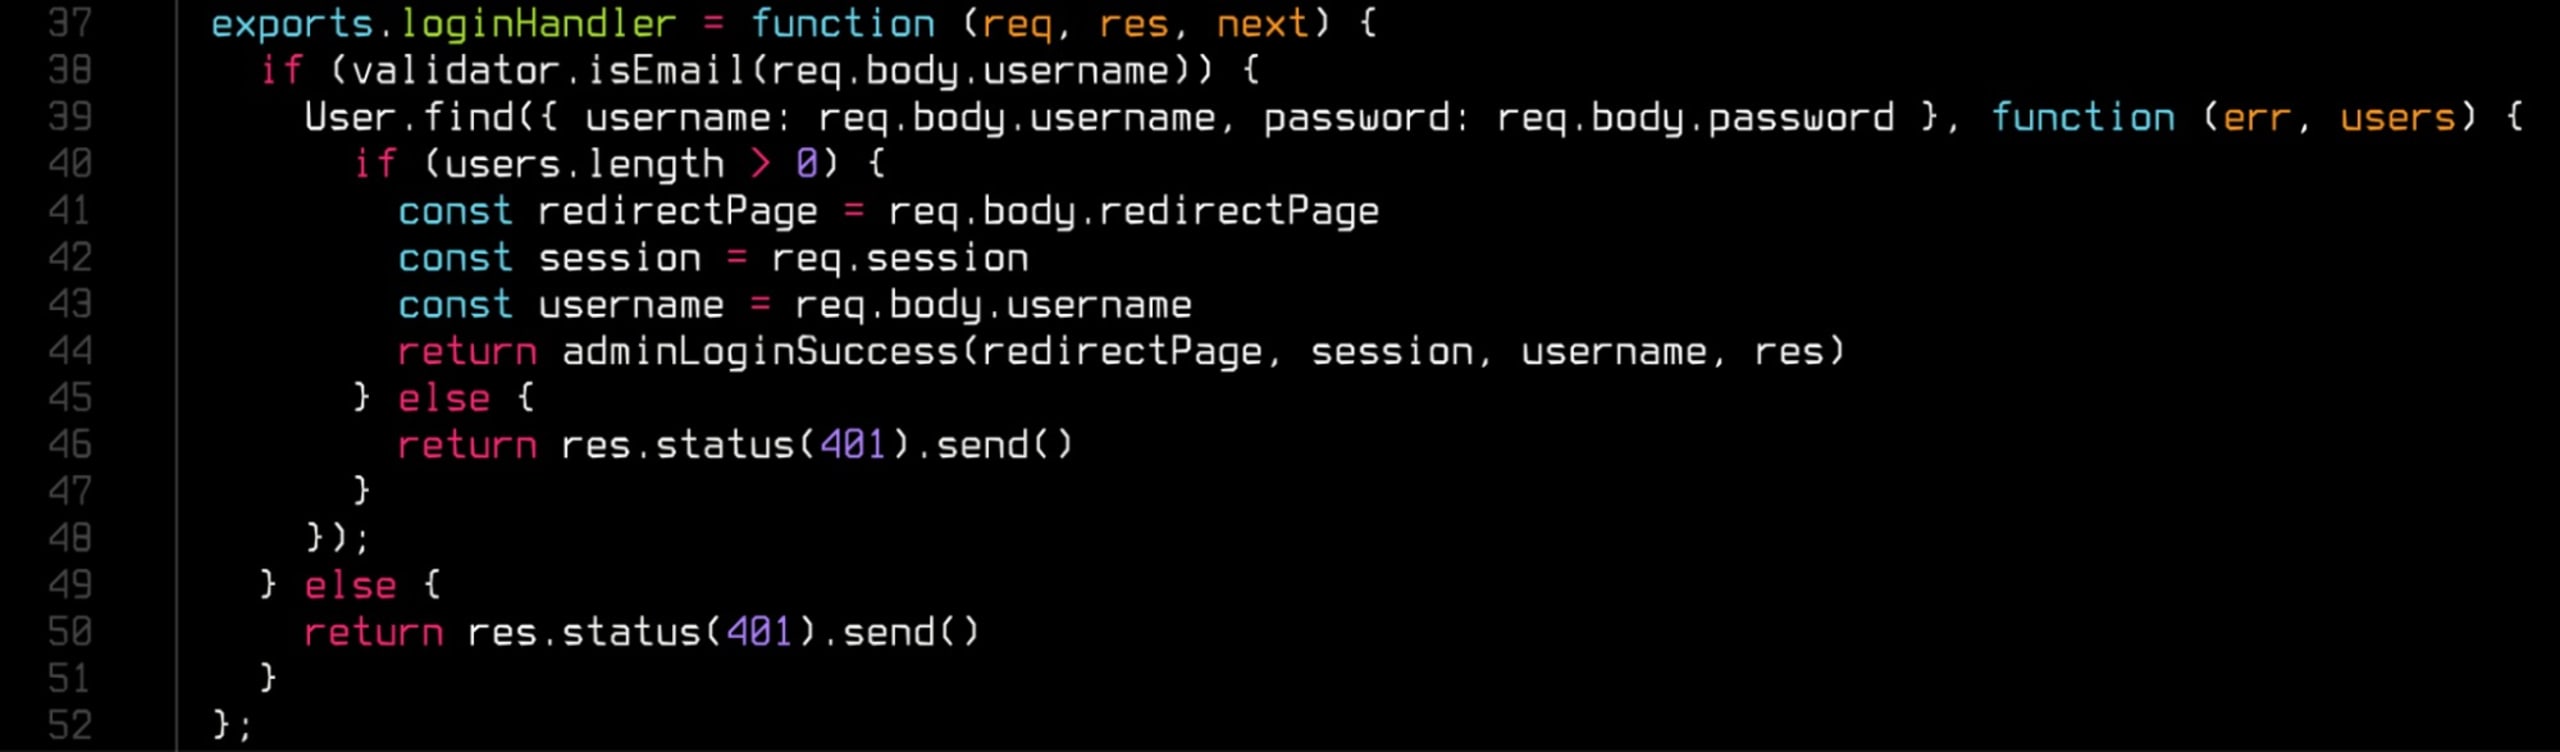
Running the Snyk Code scanner against the above example returns this report:
This kind of report is valuable in CI/CD as it provides fast feedback, but you can get even more info via the Snyk IDE plugin. Here’s the same report in the Snyk VSCode extension:
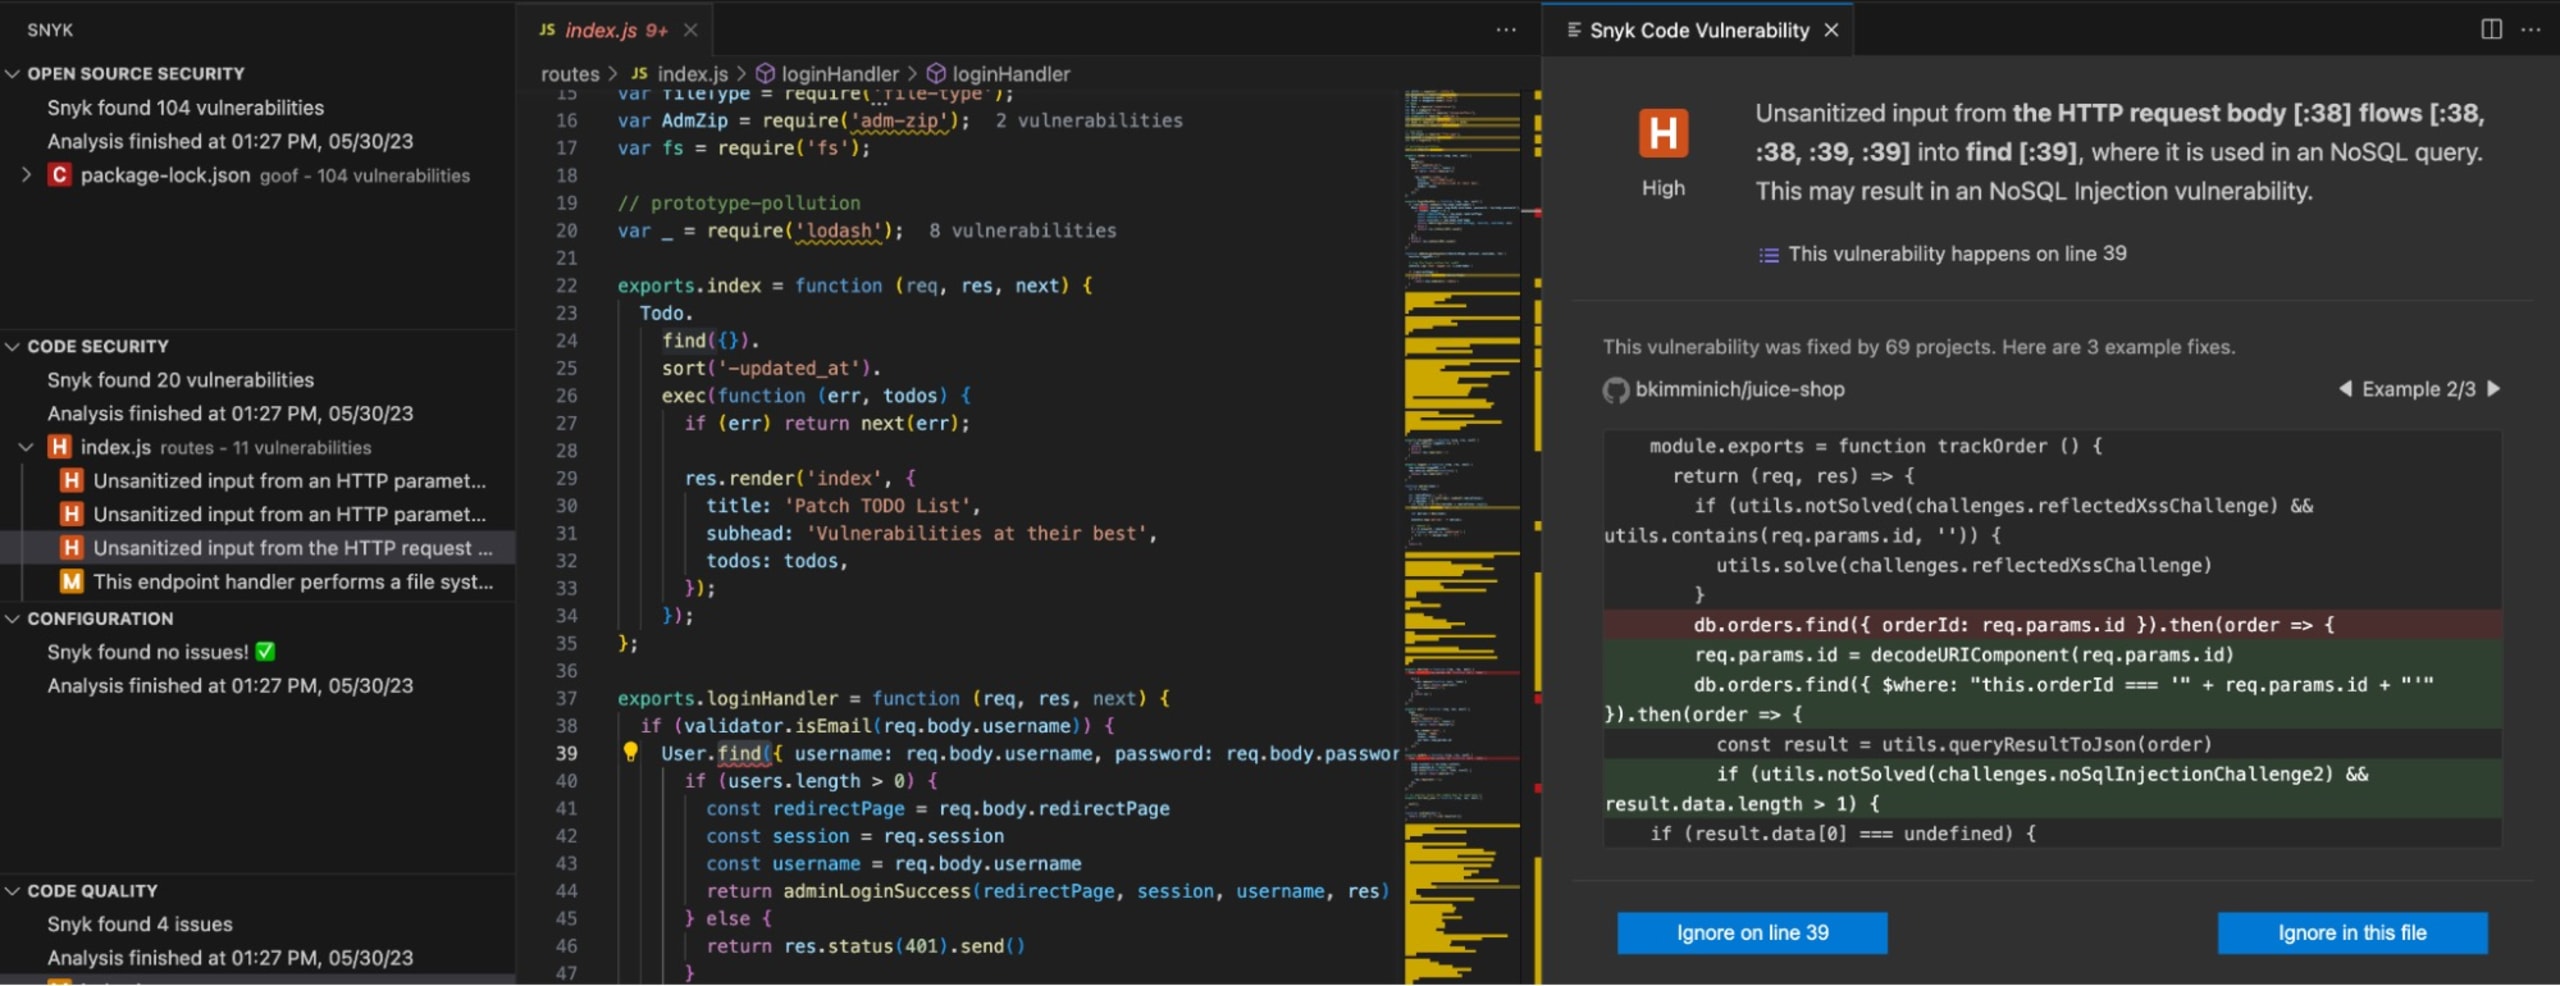
The list of issues is presented alongside additional information to train developers on what the issue can mean and examples of other open source projects that have fixed similar issues.
Giving your developers this kind of deep insight and education on security issues, with tools that are fast enough to run as part of the daily workflow, is critical to fostering a secure coding culture. Developers using Snyk Code are active participants with their security team rather than sitting in a reactionary role, receiving external audits days (or even weeks) after the code was committed.
3. Scan your container images
Many applications are now being packaged in container images for deployment to an orchestrated platform like Kubernetes. Even if your application and its dependencies are completely hardened against attack, you can still face vulnerabilities from operating system packages that come with your base image or Dockerfile. It’s best practice to build your images in an audited system like a CI server, so it’s the perfect place to vet those images with Snyk Container scanning before they even get pushed into a container image registry such as DockerHub, Amazon Elastic Container Registry (ECR), or GitHub Container Registry (GHCR). Check out our container scanning article for more information.
To scan your container, simply run the snyk container test command in your CI after you’ve built your image and before you’ve pushed it to a registry. If vulnerabilities are found, you can break the pipeline at that point and/or block a pull request from being merged.
Here’s a GitHub Action example snippet using the snyk/actions/docker action (see item 8 for details on deploying Snyk GitHub Actions):
4. Scan your IaC templates
Software-defined infrastructure has pushed the responsibility of securely provisioning and configuring application platforms all the way to the left on the pipeline. Developers are now working on Terraform, CloudFormation, Kubernetes, Helm, and other configuration files alongside their code. While the DevOps movement has empowered teams to automated infrastructure configuration, it also increases the scope of responsibility for keeping attackers at bay, and a corresponding focus on shift left security is critical to ensure security policies and practices are being followed. By scanning your IaC files with the Snyk IaC scanner as changes are brought into the pipeline, you can catch issues before malicious actors find them in production.
The following example snippet tests a single Kubernetes YAML containing a Deployment and a Service, which, among other things, alerts us that a container is defined without restricting the process from running as the root user. Additionally, a LoadBalancer type Service is being declared without restricting the IP range allowed to access it. The reports include links to Snyk documentation for developers to learn more about the issues.
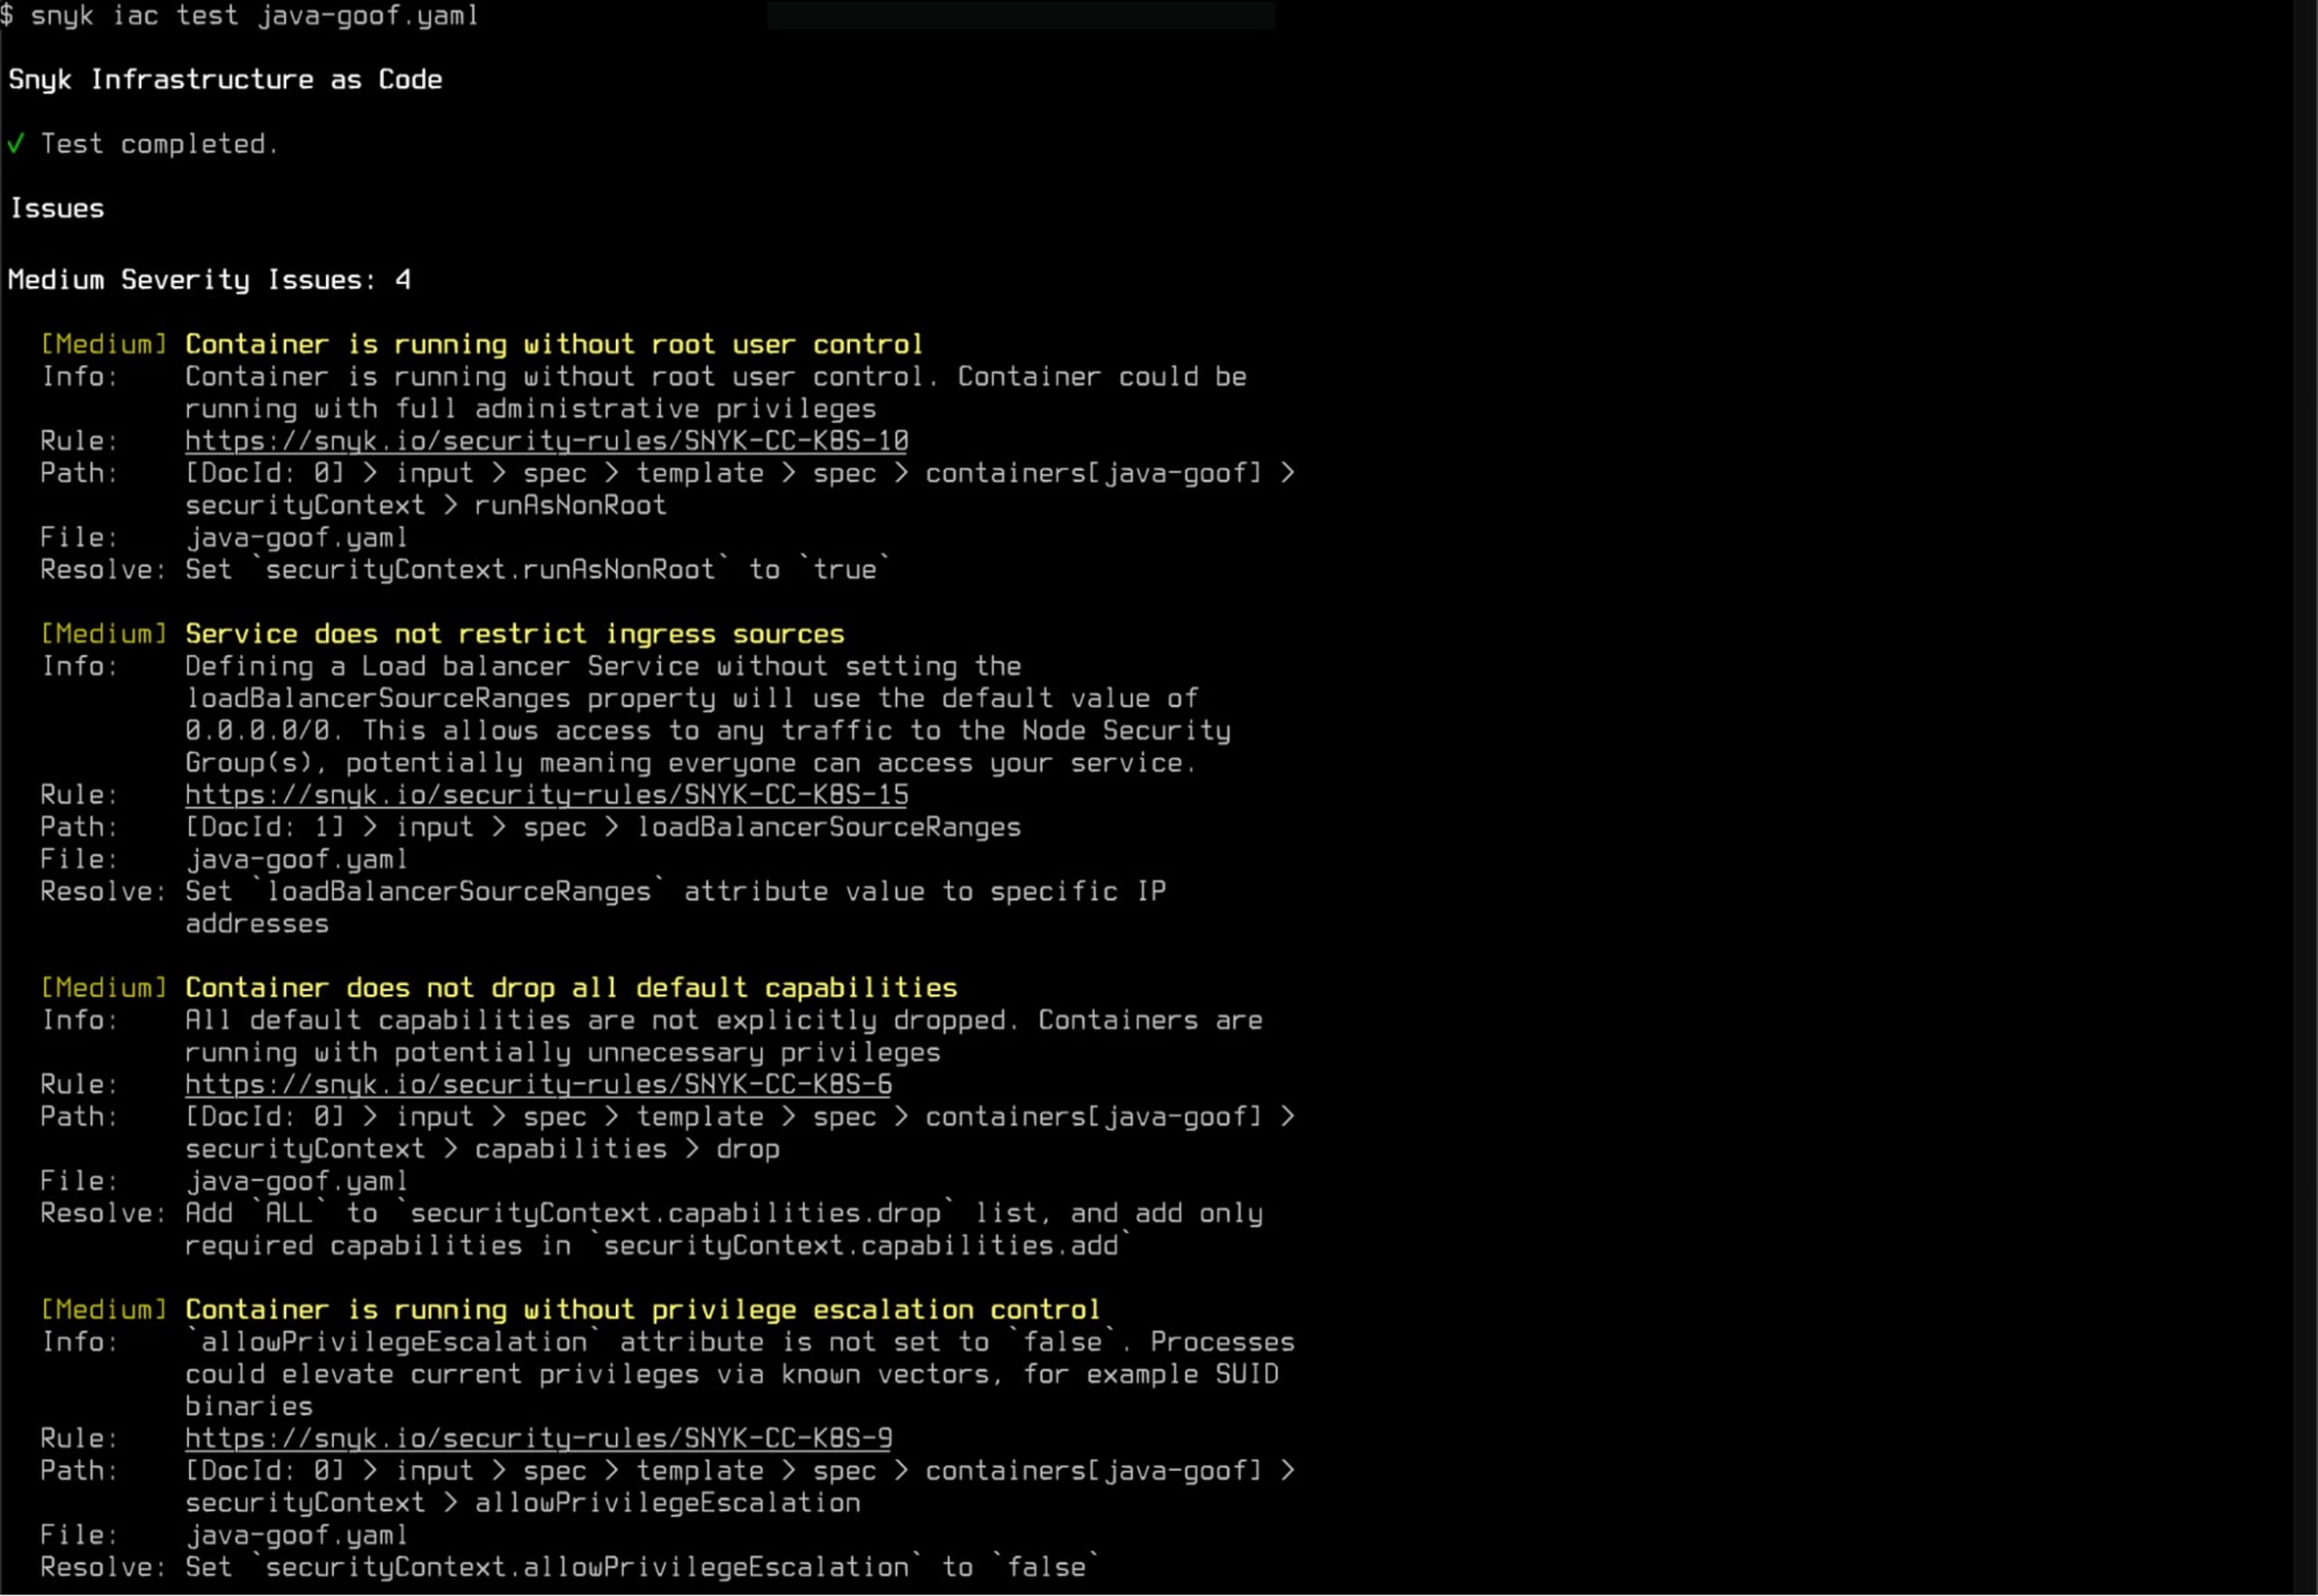
But what if my application actually does need to run as root? Or maybe we don’t want to restrict ingress at all? The Snyk IaC scanning policy levels can be customized for all of your projects via the Snyk control panel for your organization. Simply find the rule in the infrastructure as code settings and change the level to “None” (or whatever level is appropriate for your project).

Finally, you can customize how issues are reported on at a per-project/repository level using a standard .snyk policy file. There are many options available, so check out the documentation pages to learn more.
5. Keep an eye on Licenses
The licenses used by all open source packages that applications depend on need to be audited to avoid legal issues. For example, your company may restrict all GPL licenses and you might not be aware of one that is being used several layers deep in the transitive dependencies of your npm modules. Snyk Open Source scanner automatically detects out-of-policy licenses and includes them as issues alongside CVEs if your Snyk account is configured to do so.
Note: License scanning is part of Snyk’s paid tiers and will not appear on free tier output. Refer to the Snyk documentation for more information.
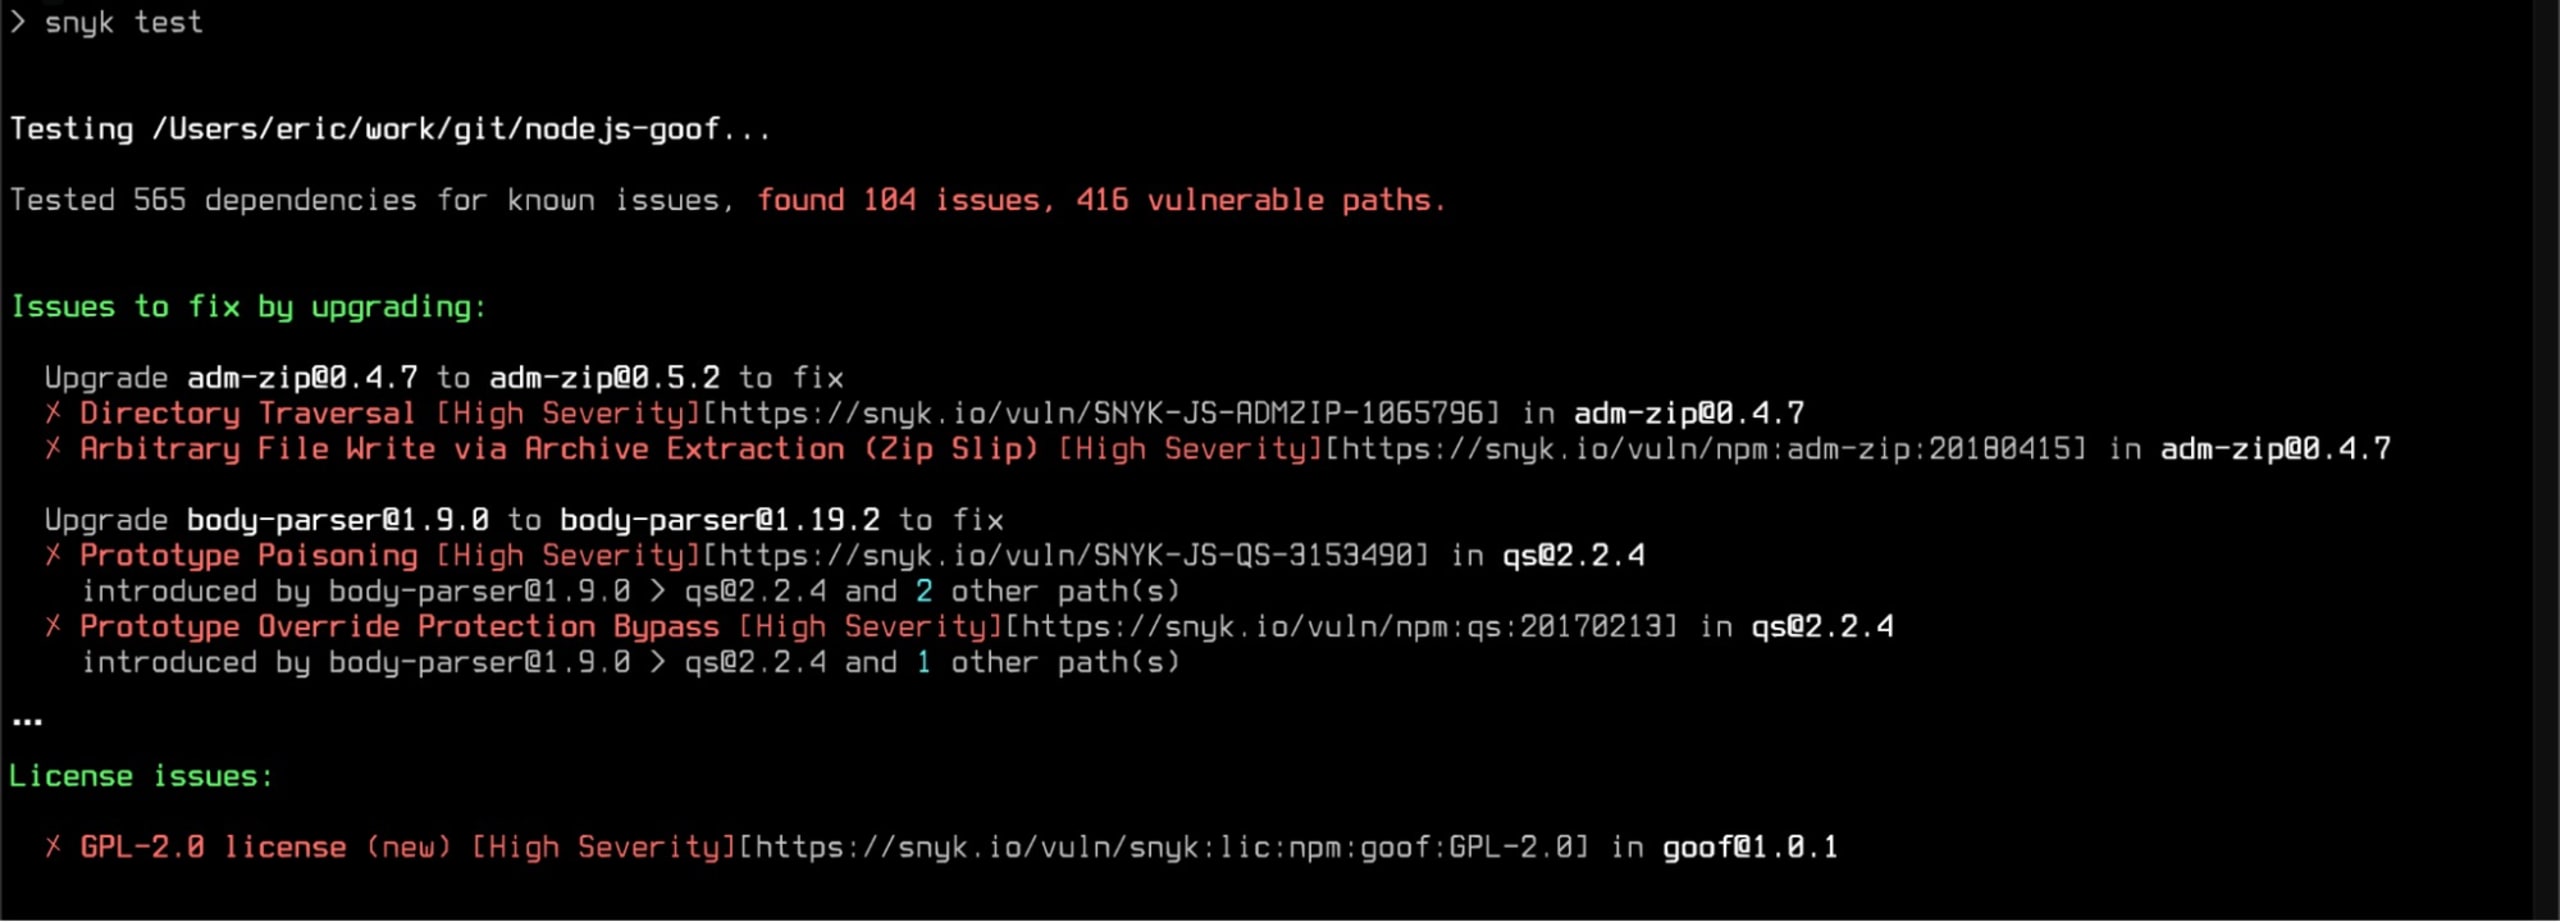
Let’s look at a simple example from a Snyk Open Source scan log. In this case, we have a GPL-2.0 license in the top level of the application (named “goof”).
6. Start on the desktop
As with any SDLC pipeline process, fast feedback is the goal, so you should implement Snyk early in the development process to detect vulnerabilities as early as possible. This is often called “shifting left” because, in most cases, pipelines are drawn as a left-to-right flow chart with code coming into the picture on the left and deployment to production on the right.

Shifting security as far left as possible means scanning before the code ever committed, right on the developer's desktop. Snyk CLI and IDE plugins enable developers to include the same security scanning tools used in later stages right into their desktop workflow, allowing them to catch vulnerabilities often as they are introduced. This extremely tight feedback loop ensures that the context of what they did to introduce the problem is fresh on their mind and the fix is immediately actionable.
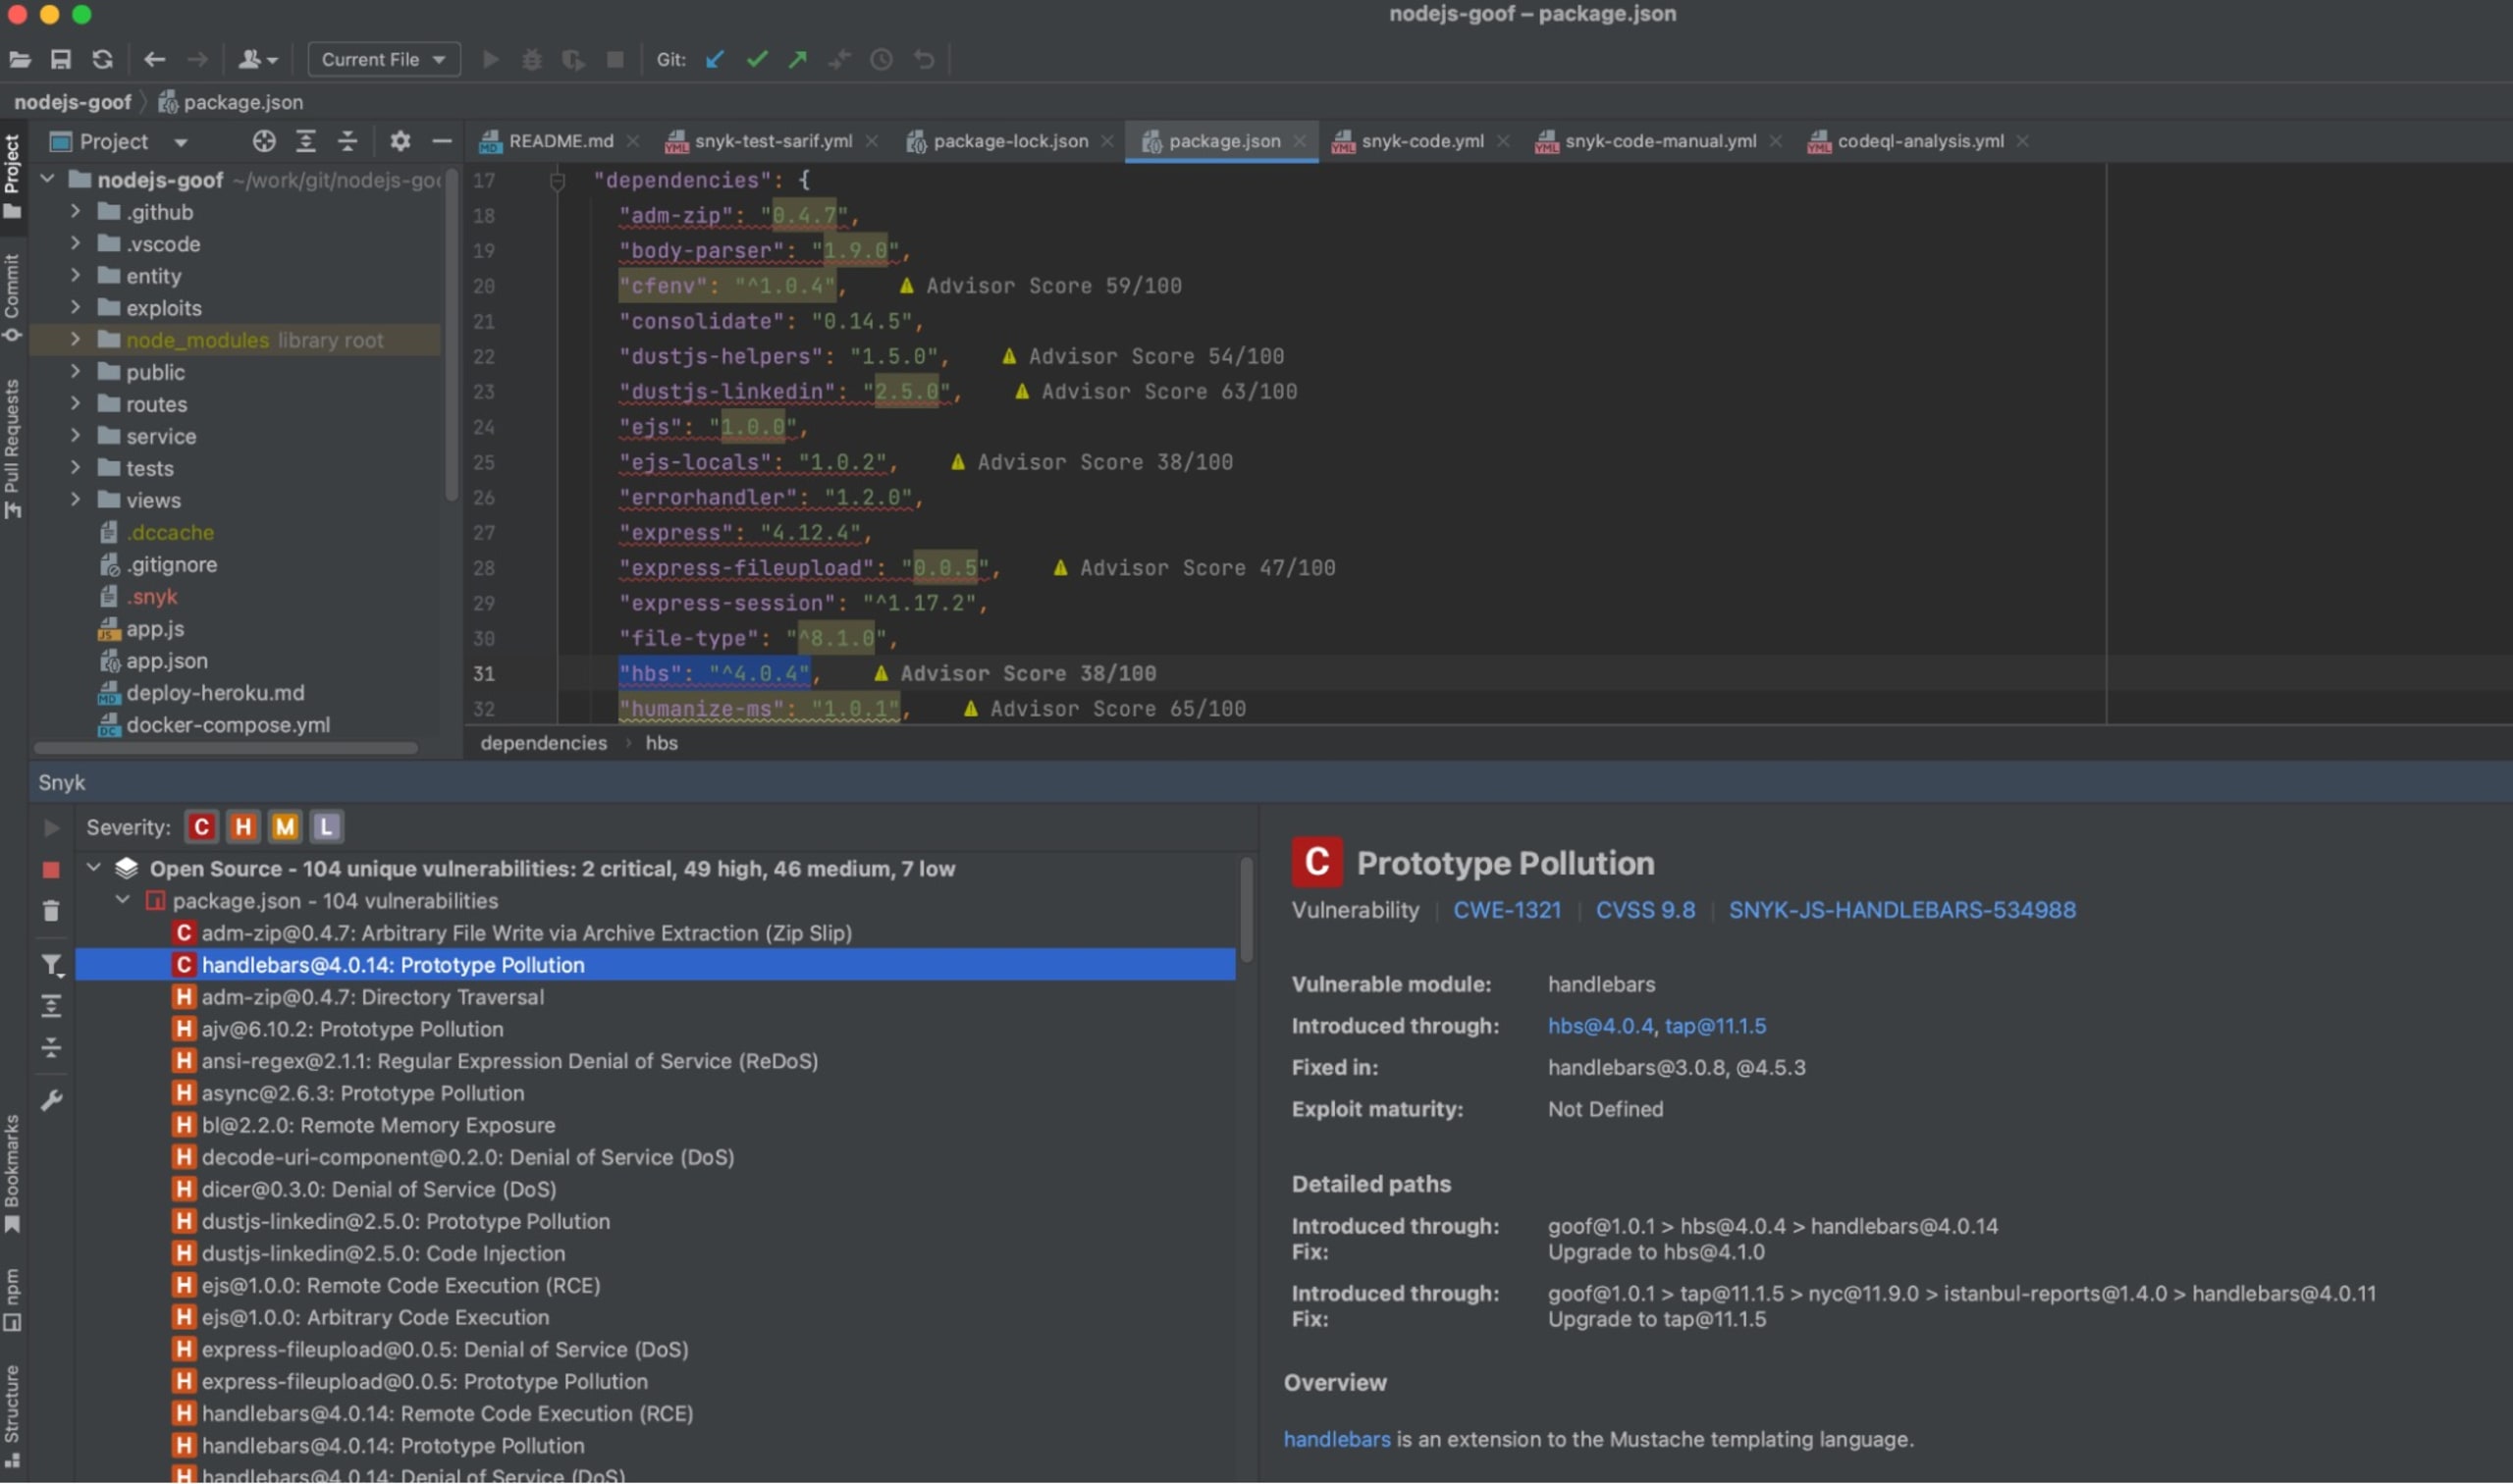
In your IDE, install the Snyk plugin/extension via the editor’s built-in marketplace search functionality. Here’s an example representative of the JetBrains suite of IDEs showing the results of Snyk Open Source scan of a Node.js application:
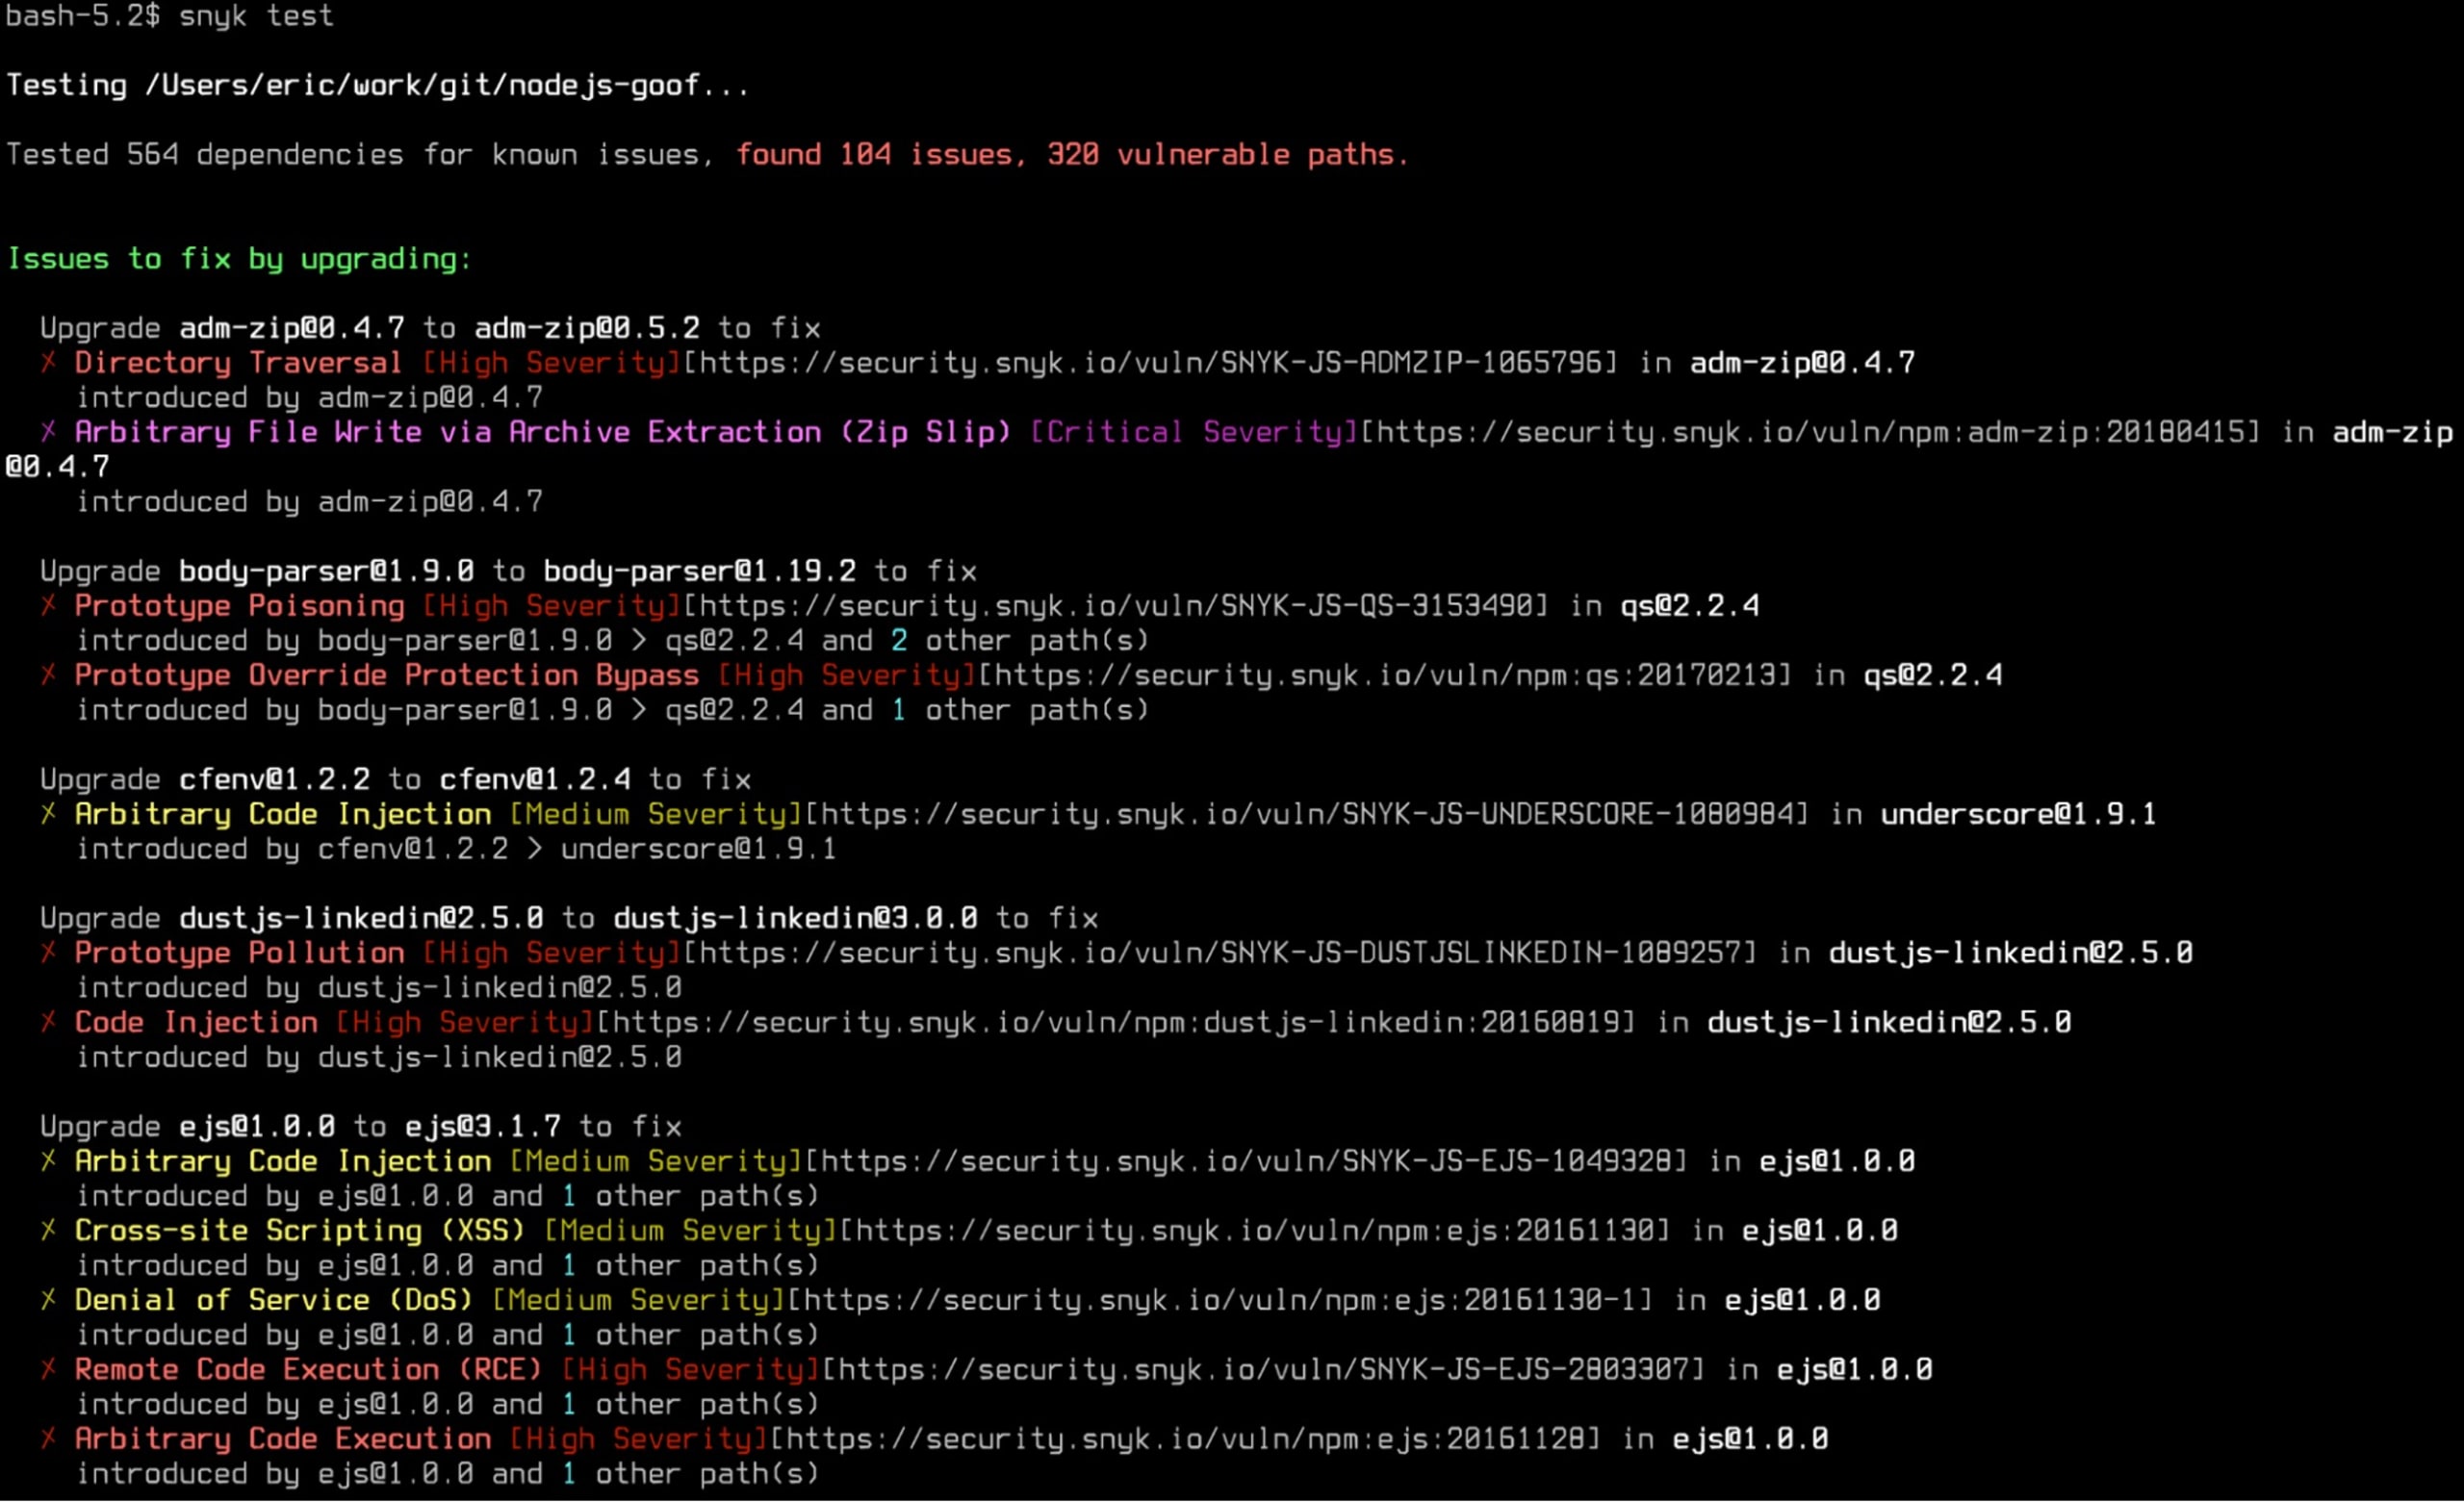
There are several installation options available for the CLI tool. Find yours and run snyk test from the root of your application’s directory structure. (i.e., Where your package management files live.)
7. CI pre and post merge scanning
After code is pushed up to a code repository, your CI server will usually be notified and automatically begin building and testing your code. In many cases, this is a two-step process with pre- and post-merge stages.
Pre-merge
In most modern CI/CD pipelines, there is a set of automated tests and/or code review tasks that must pass before any changes can be merged into the parent/main codebase branch. In Git SCMs, this is usually done via a “pull request” (PR) — sometimes called a “merge request” — the creation of which triggers CI automation to kick off a pre-merge build and test in an attempt to ensure that the change won’t introduce a breakage when merged.
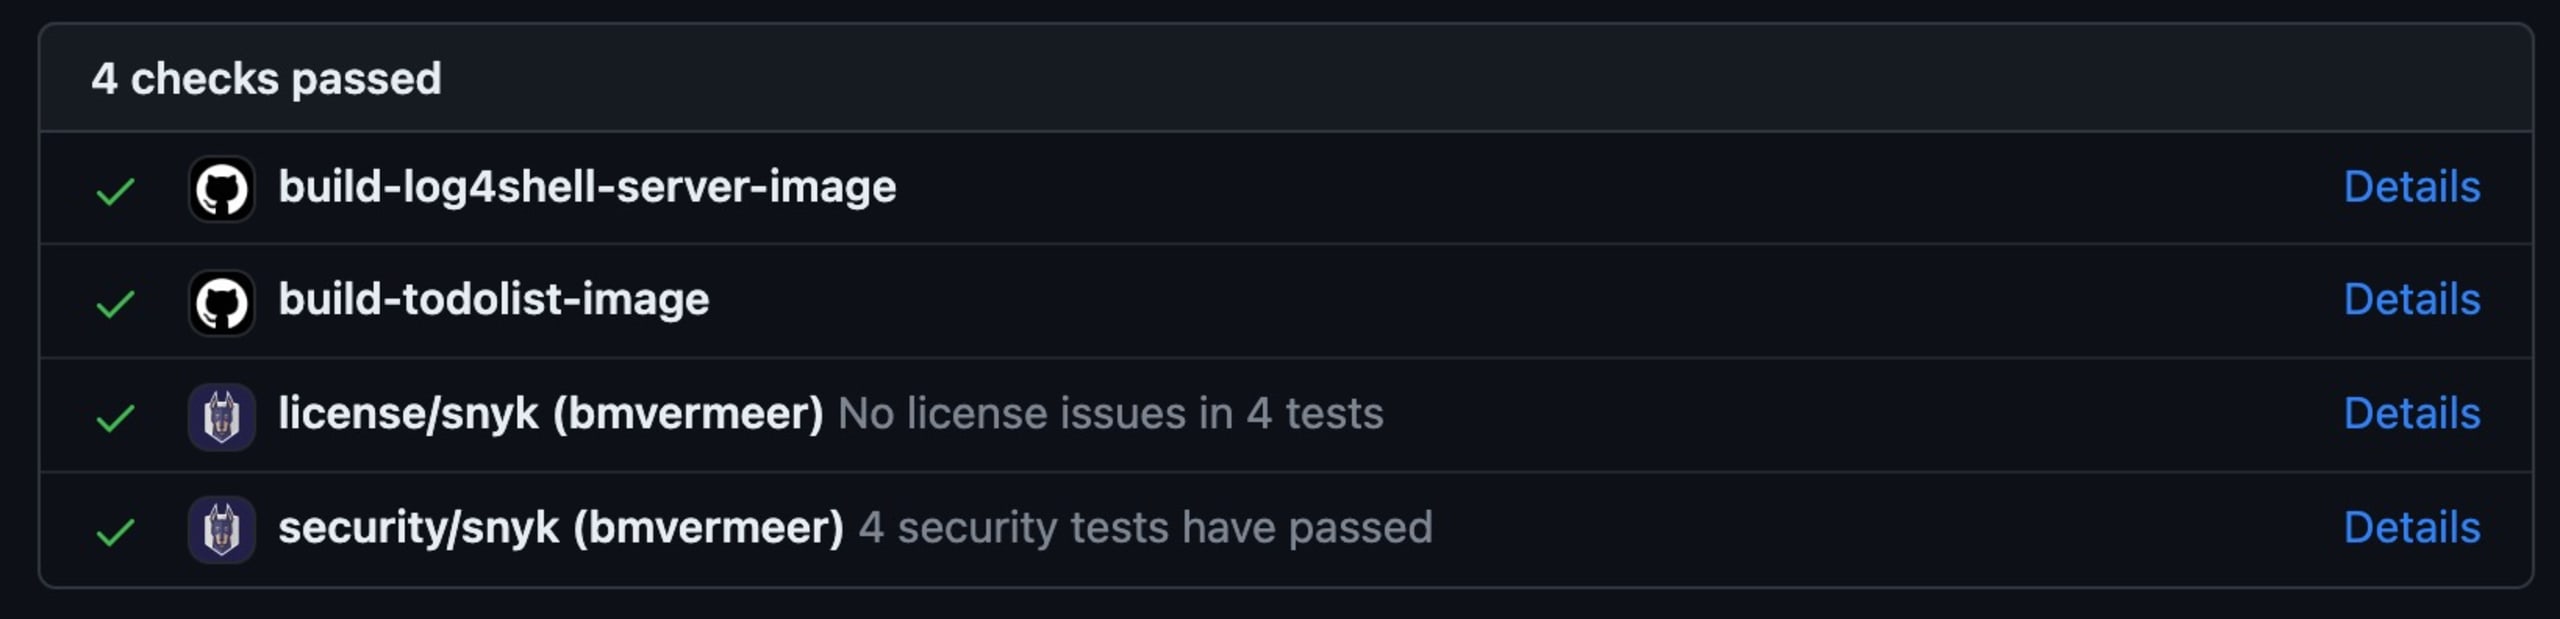
Snyk test scanning can be run at this stage to ensure that the changes being introduced aren’t going to add new vulnerabilities to the application as of the time the scan was run. This is both a safety measure — in case the developer hadn’t run the scan themselves — and a way to document the scan results as they become a part of the build system reporting.
Post-merge
Once the code is integrated into the main code branch, it’s critical to kick off a build and run automated tests and security scans. This is true regardless of your project’s branching strategy, even if the changes were already tested and scanned as part of a PR, and is especially important if you allow direct-to-main commits by the developers (sometimes known as Trunk Based Development). Building, testing, and scanning at this point is where CI begins, as it is the first point of actual integration with the code shared with the rest of the team. If those changes break the build or introduce CVEs, you want to know immediately and resolve that problem before other changes come in on top of it or, worse, it gets deployed anywhere. Many pipelines treat a test or scan failure as build breaking and figuratively pull the andon cord to stop the assembly line until it is resolved.
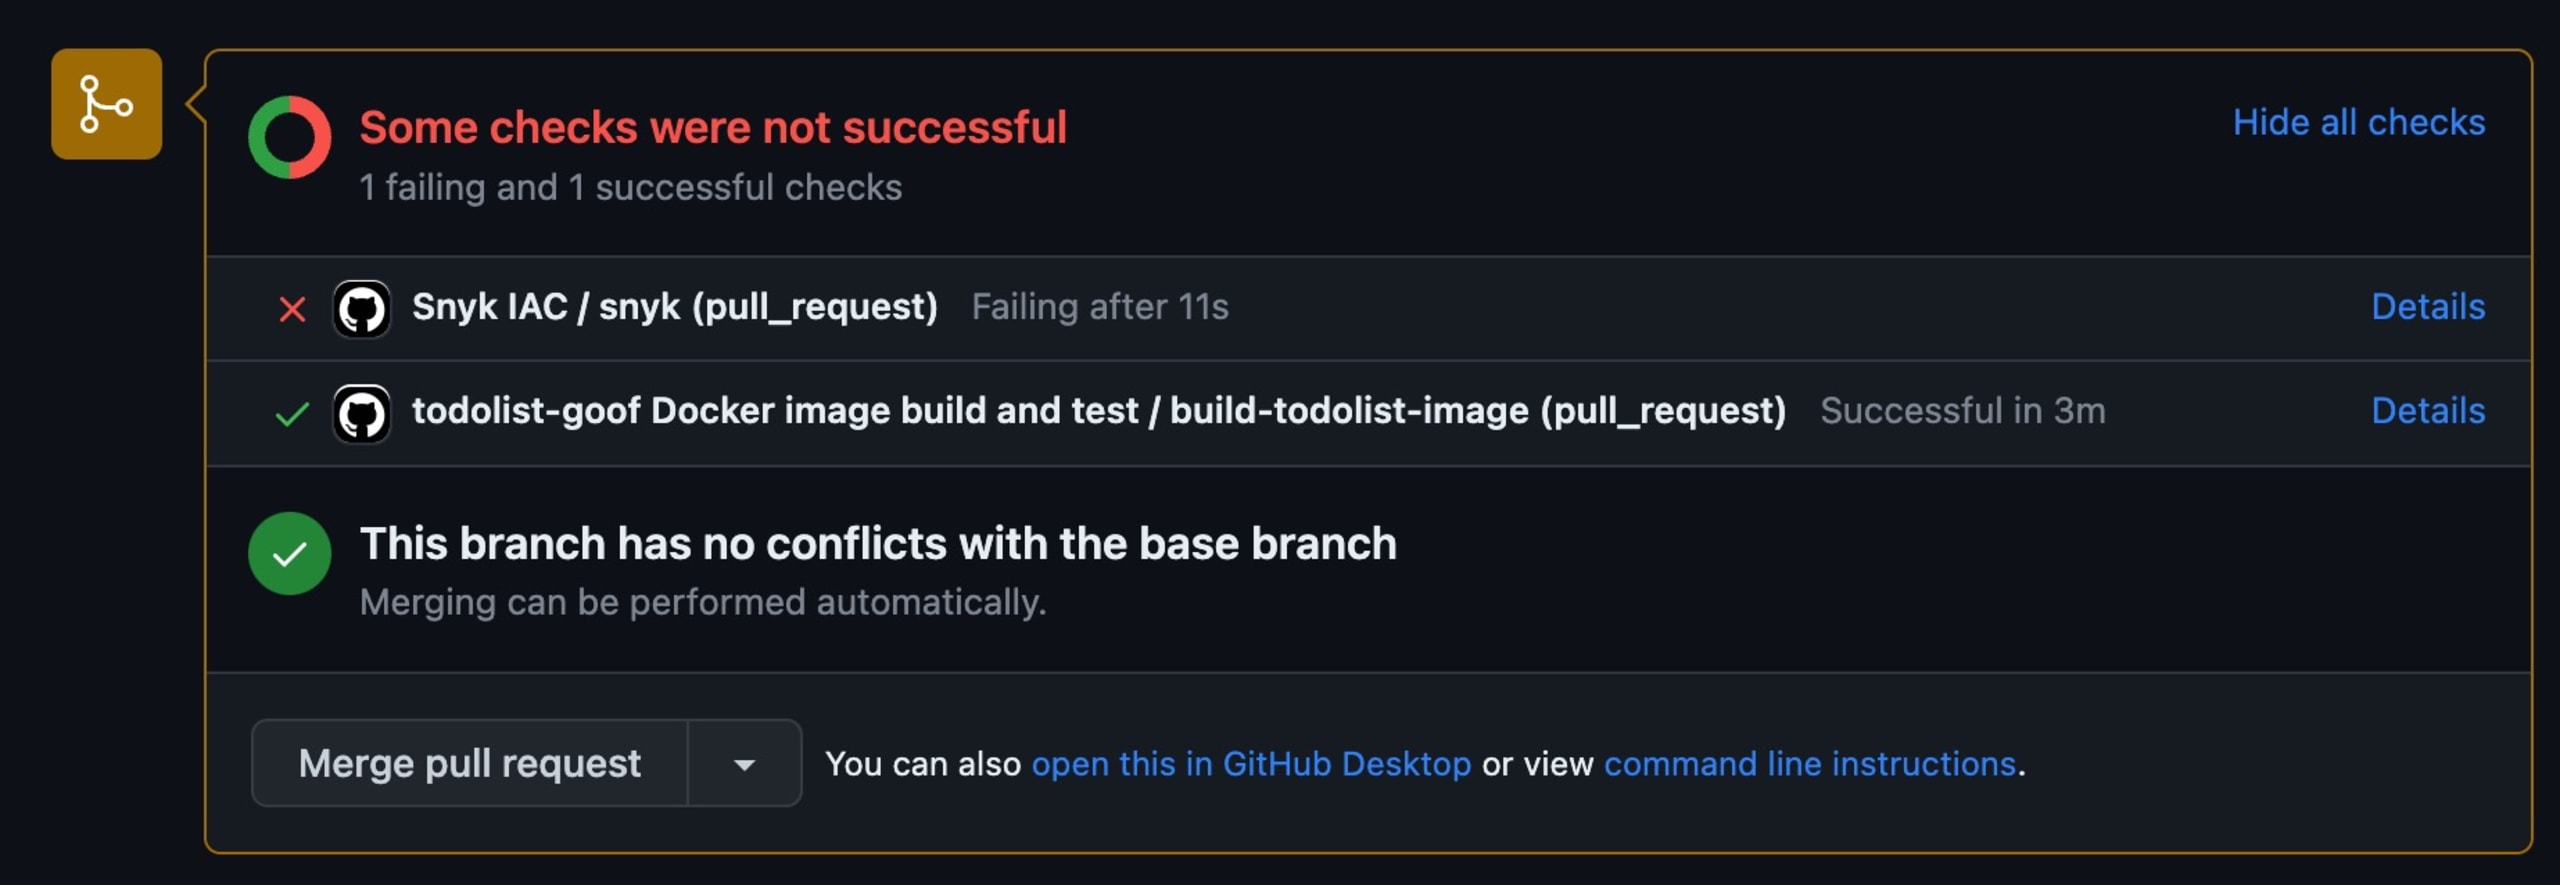
In the next section, we’ll review how to implement these kinds of scans in a few common CI/CD platforms.
8. Deploying Snyk in your CI/CD platform
In the prior section, we talked about pre and post-commit checks. Now, we will look at how you can implement them. There are many different CI/CD platforms and various ways to integrate Snyk with each, but they all fall under three basic categories:
Use a Snyk plugin/action for the platform
Run the Snyk CLI from a shell step
Run the Snyk CLI inside a container using one of Snyk’s official images
In this section, we’ll go over a few examples — but before we get into them, make sure that your Snyk account is set up and that you have the API token for your account or service account (service accounts are available on select account tiers). If you don’t already have a Snyk account, you can get a free one at https://snyk.io/signup.
Example 1: Snyk Jenkins plugin
First, make sure you’ve installed the Snyk Security plugin on your Jenkins server and set up your API token with it. Full instructions to do this are available here. While there are probably a million ways to build in Jenkins, the two most common project types are Pipeline and Freestyle, so we’ll focus on them here.
Example 1a: Using Snyk in Jenkins pipeline projects
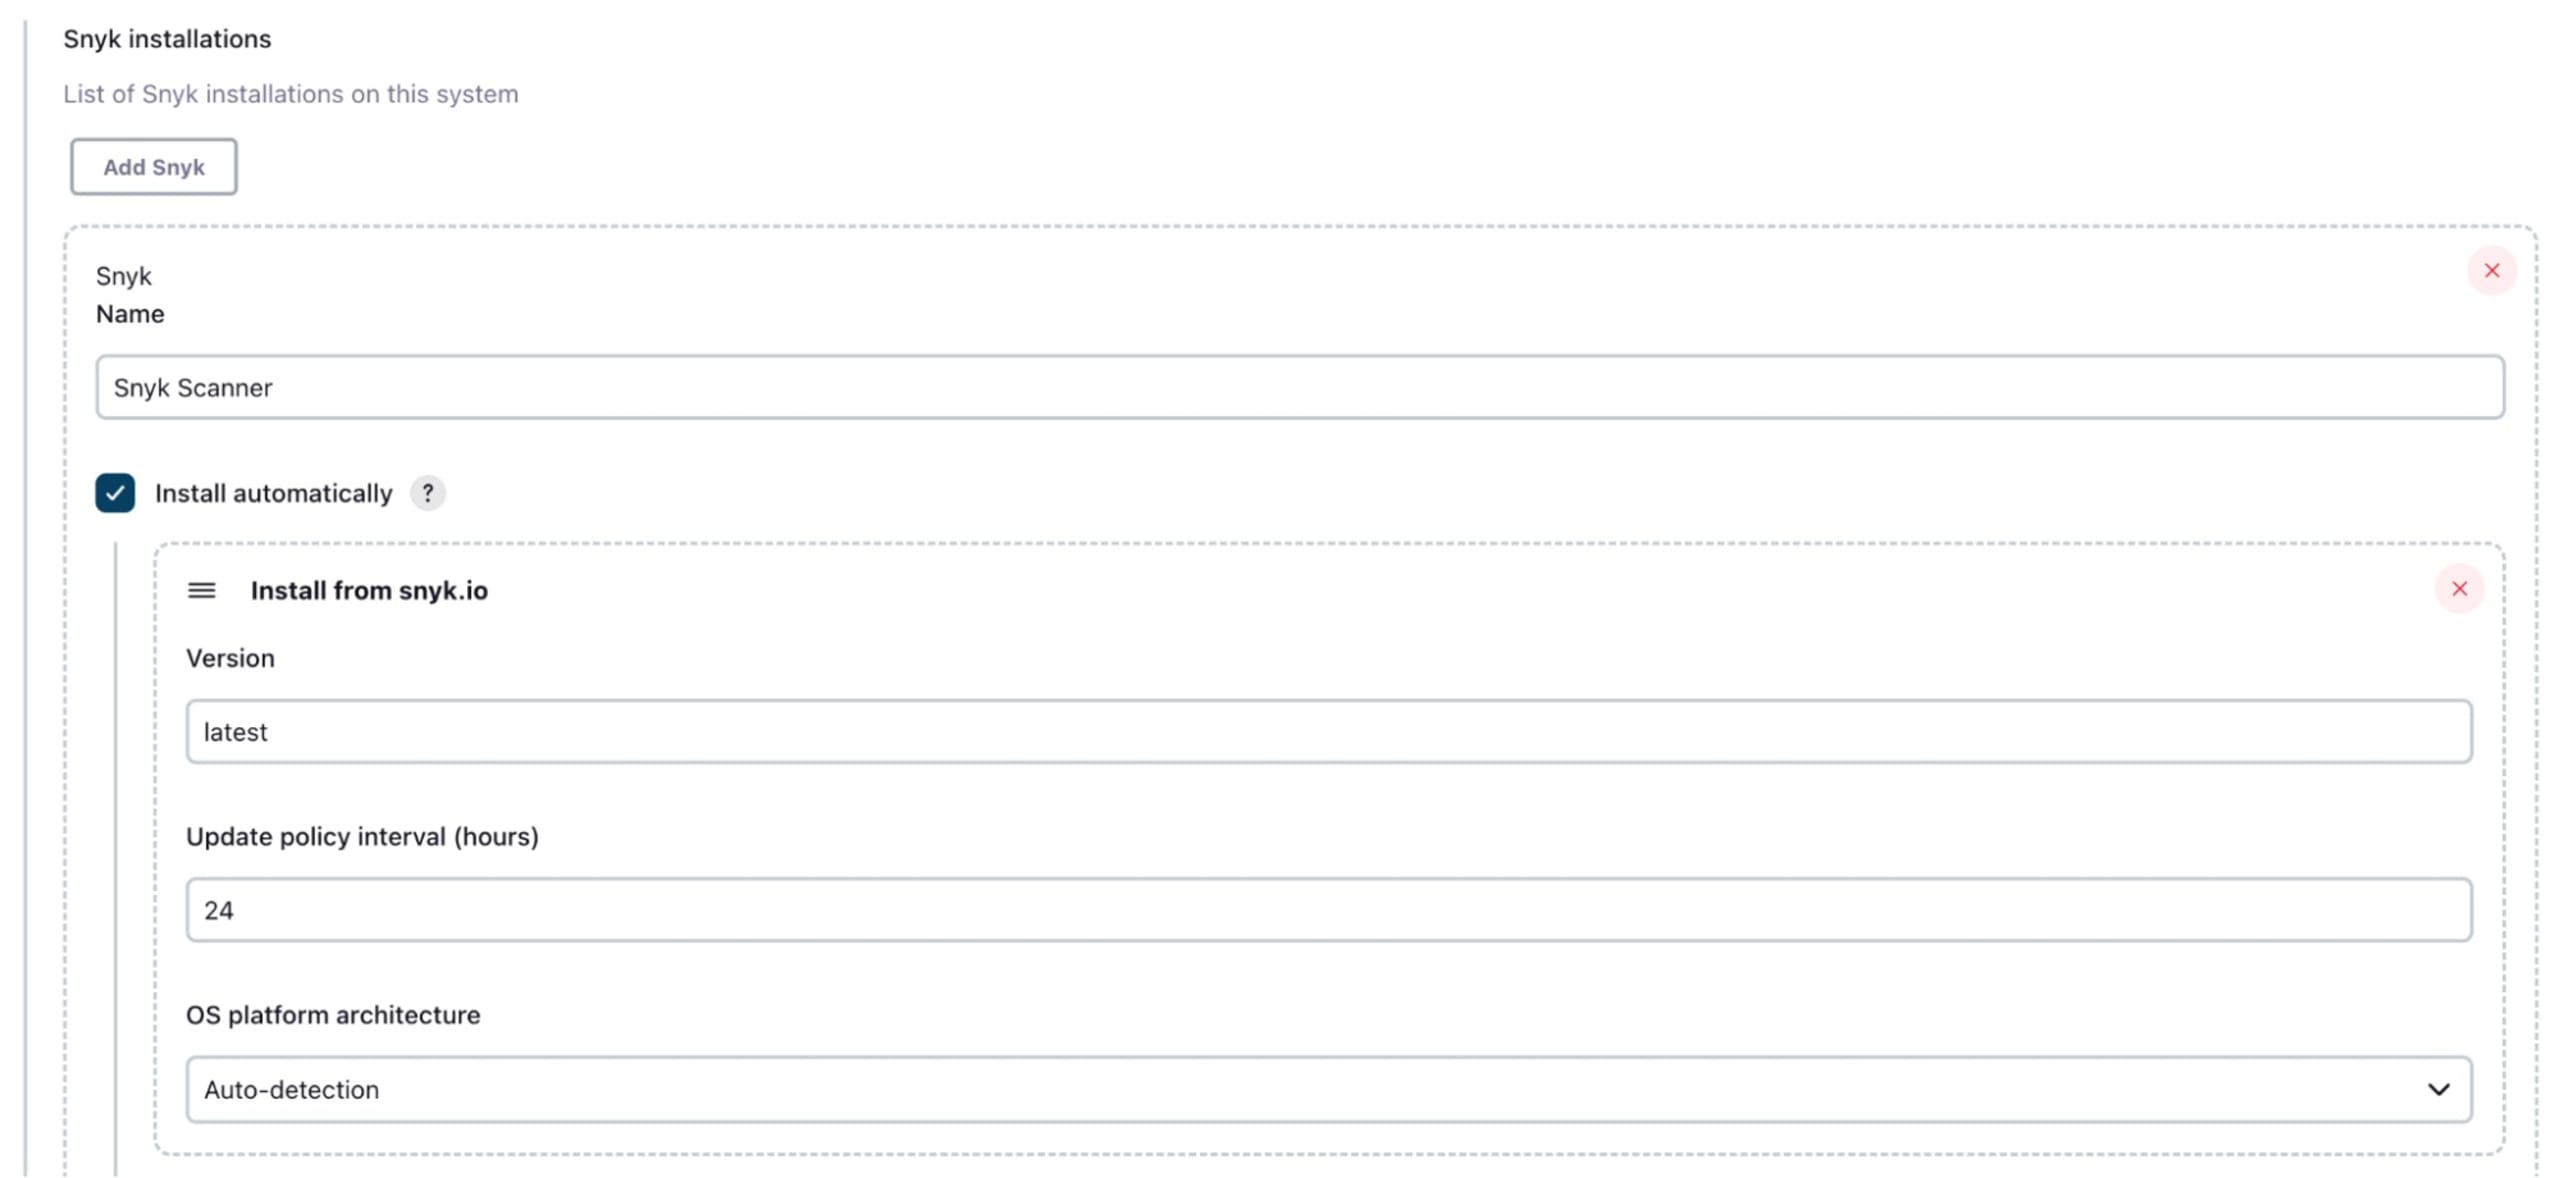
Assuming you have the Jenkins Snyk plugin installed, here is an example stage snippet from a Jenkins declarative pipeline that will utilize an installation configured via the Jenkins “Global Tool Configuration” panel with the name “Snyk Scanner”, and a Snyk Auth Token configured as a Jenkins credential with the name “MyAppTeamSnykToken”.
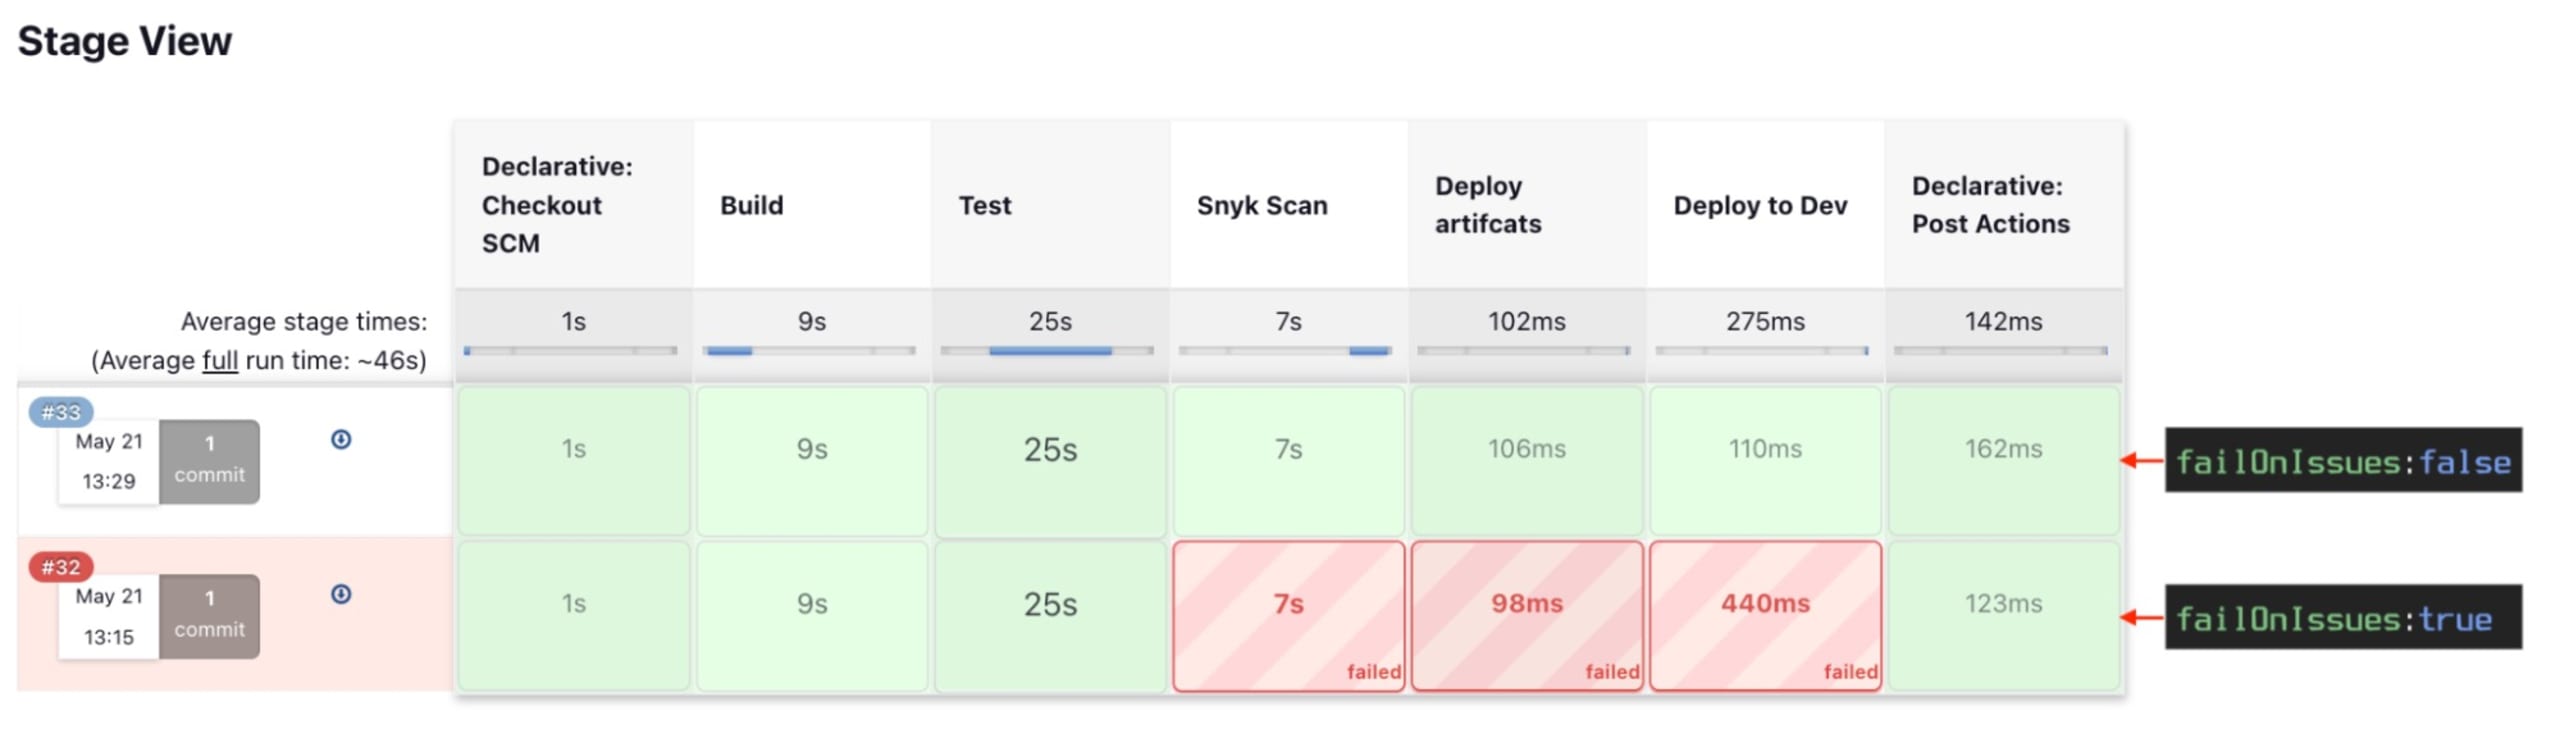
By including a stage like this, your pipeline view will now contain a stage where OpenSource vulnerability scans are being run against your application. The failOnIssues flag included in the example will allow your pipeline to continue to later stages, even if vulnerabilities are found. If you want the build job to fail, simply change the value to true. The other flag, monitorProjectOnBuild: false, controls the creation of Snyk automated monitoring. We will cover that in the next section.
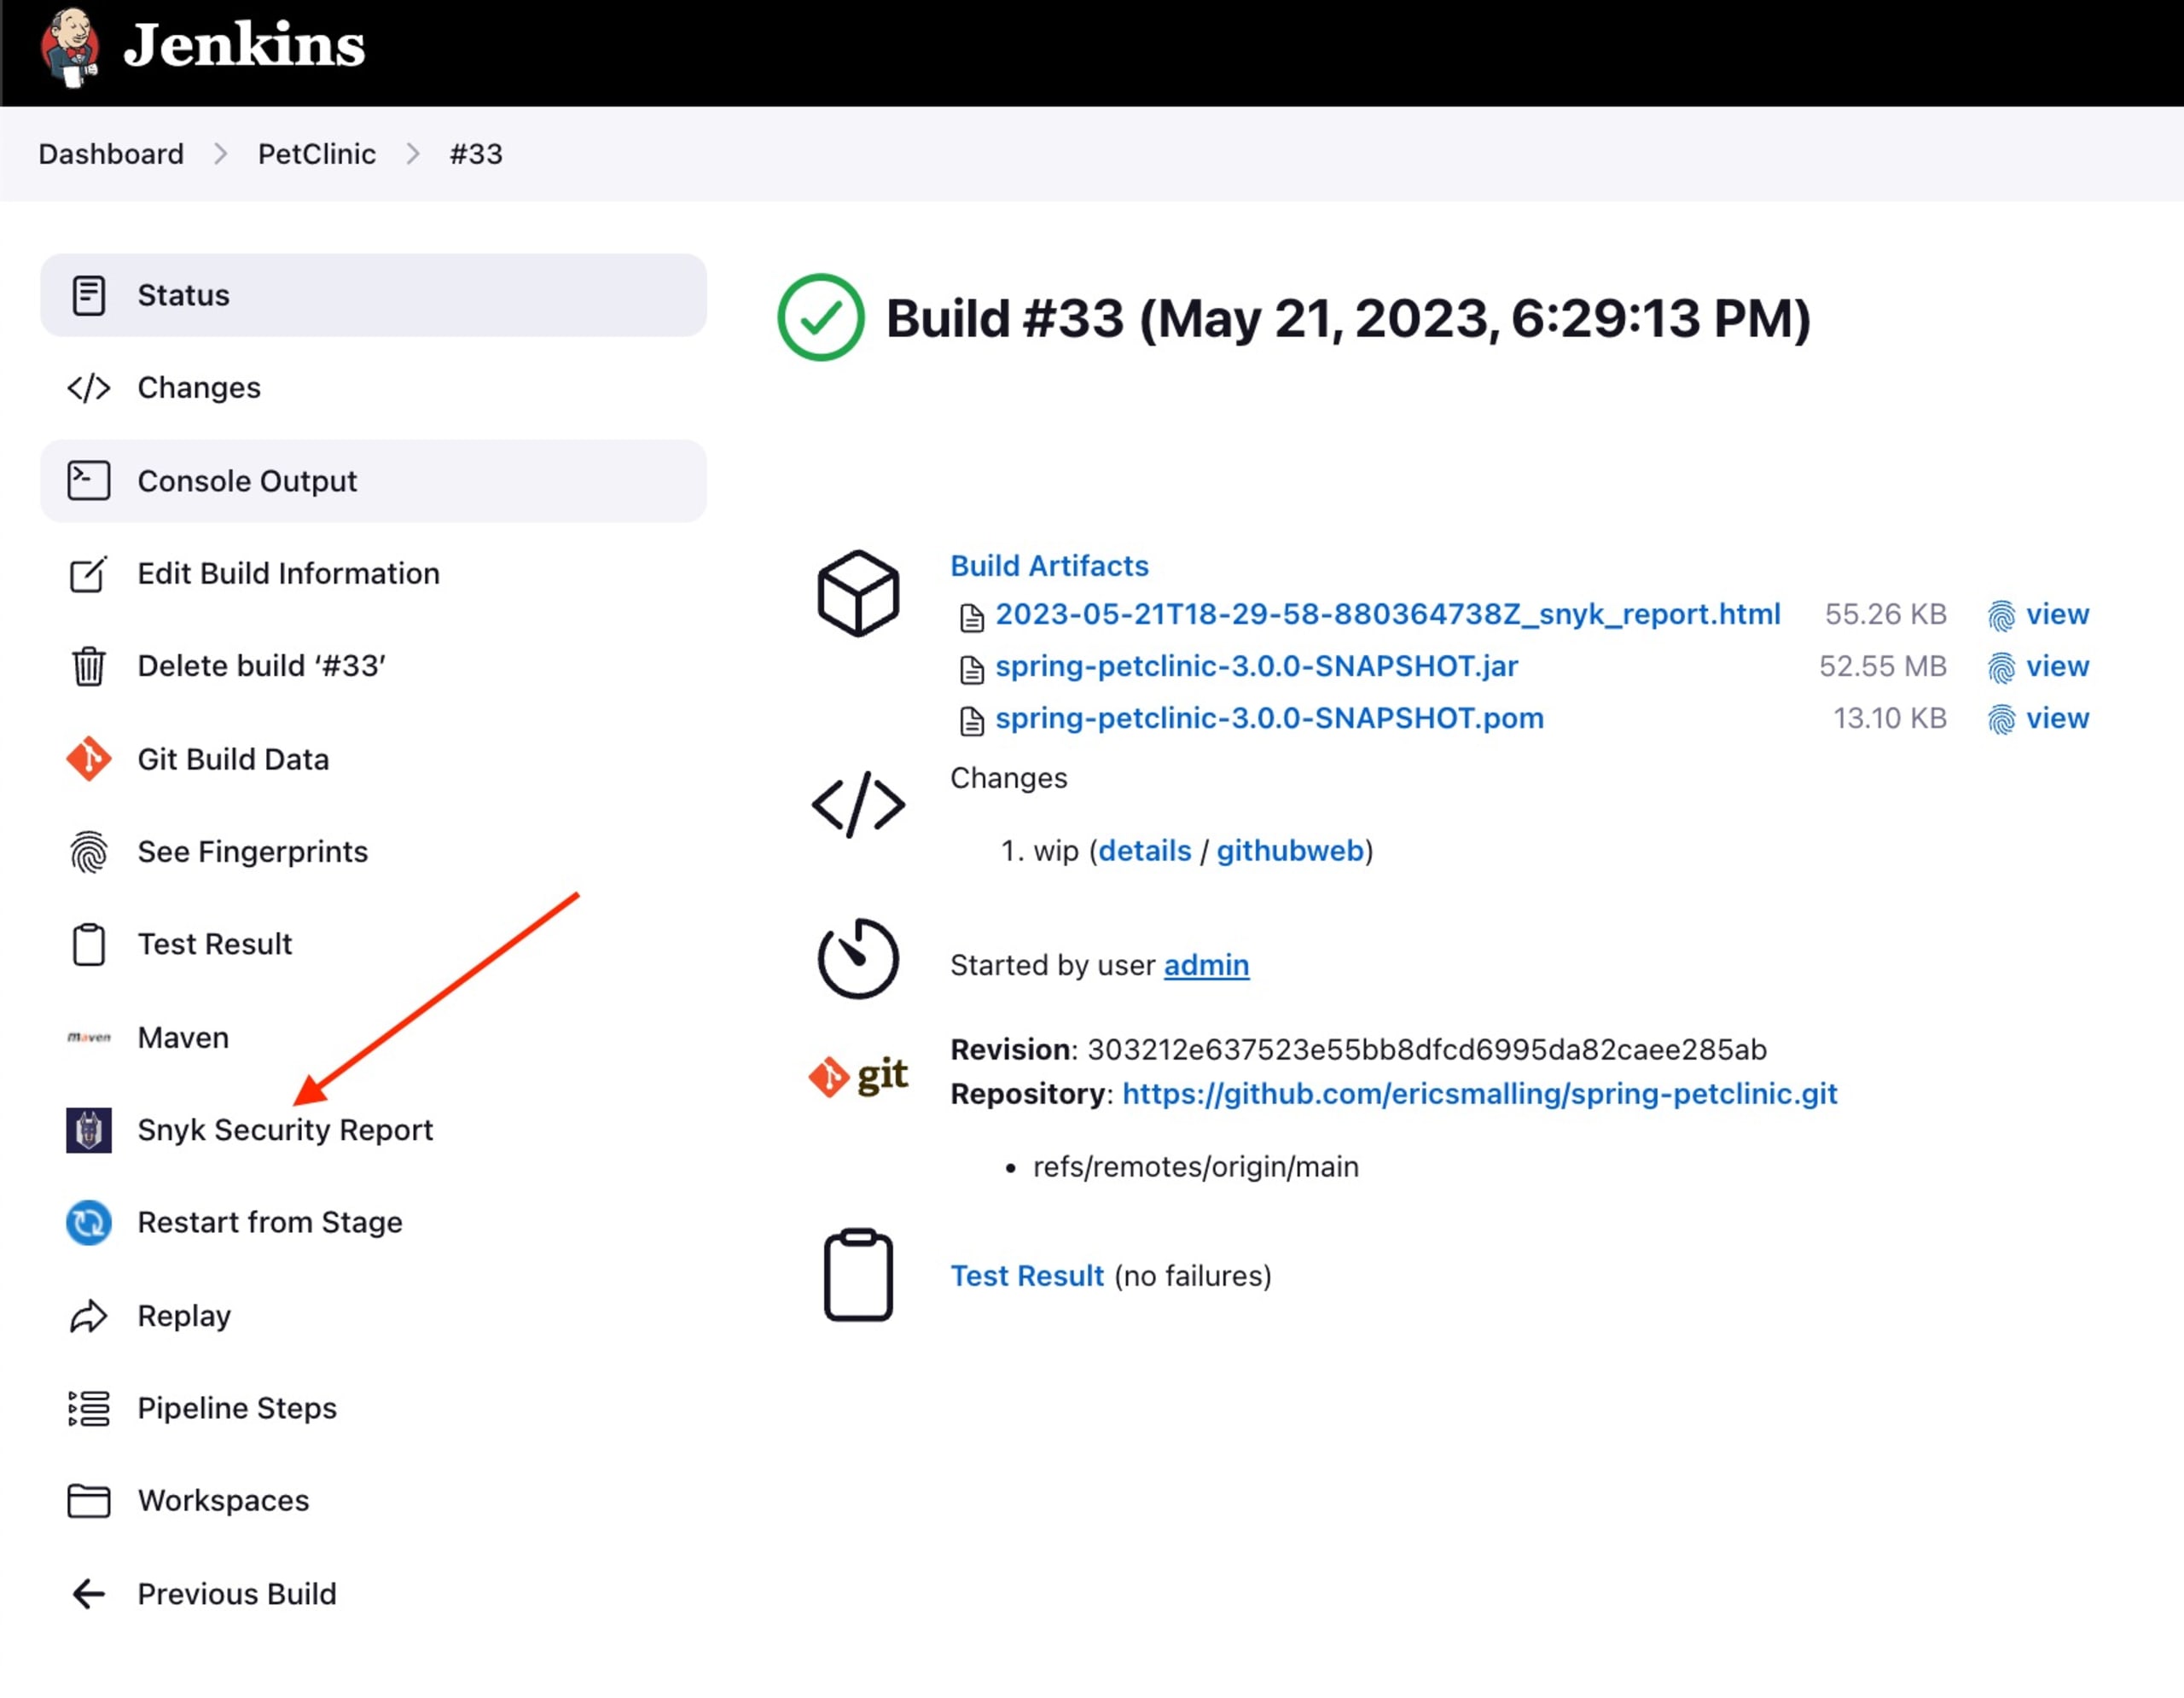
In either case, a report of the Snyk scan can be seen by clicking on the build job, then the “Snyk Security Report” item on the left side of the page.
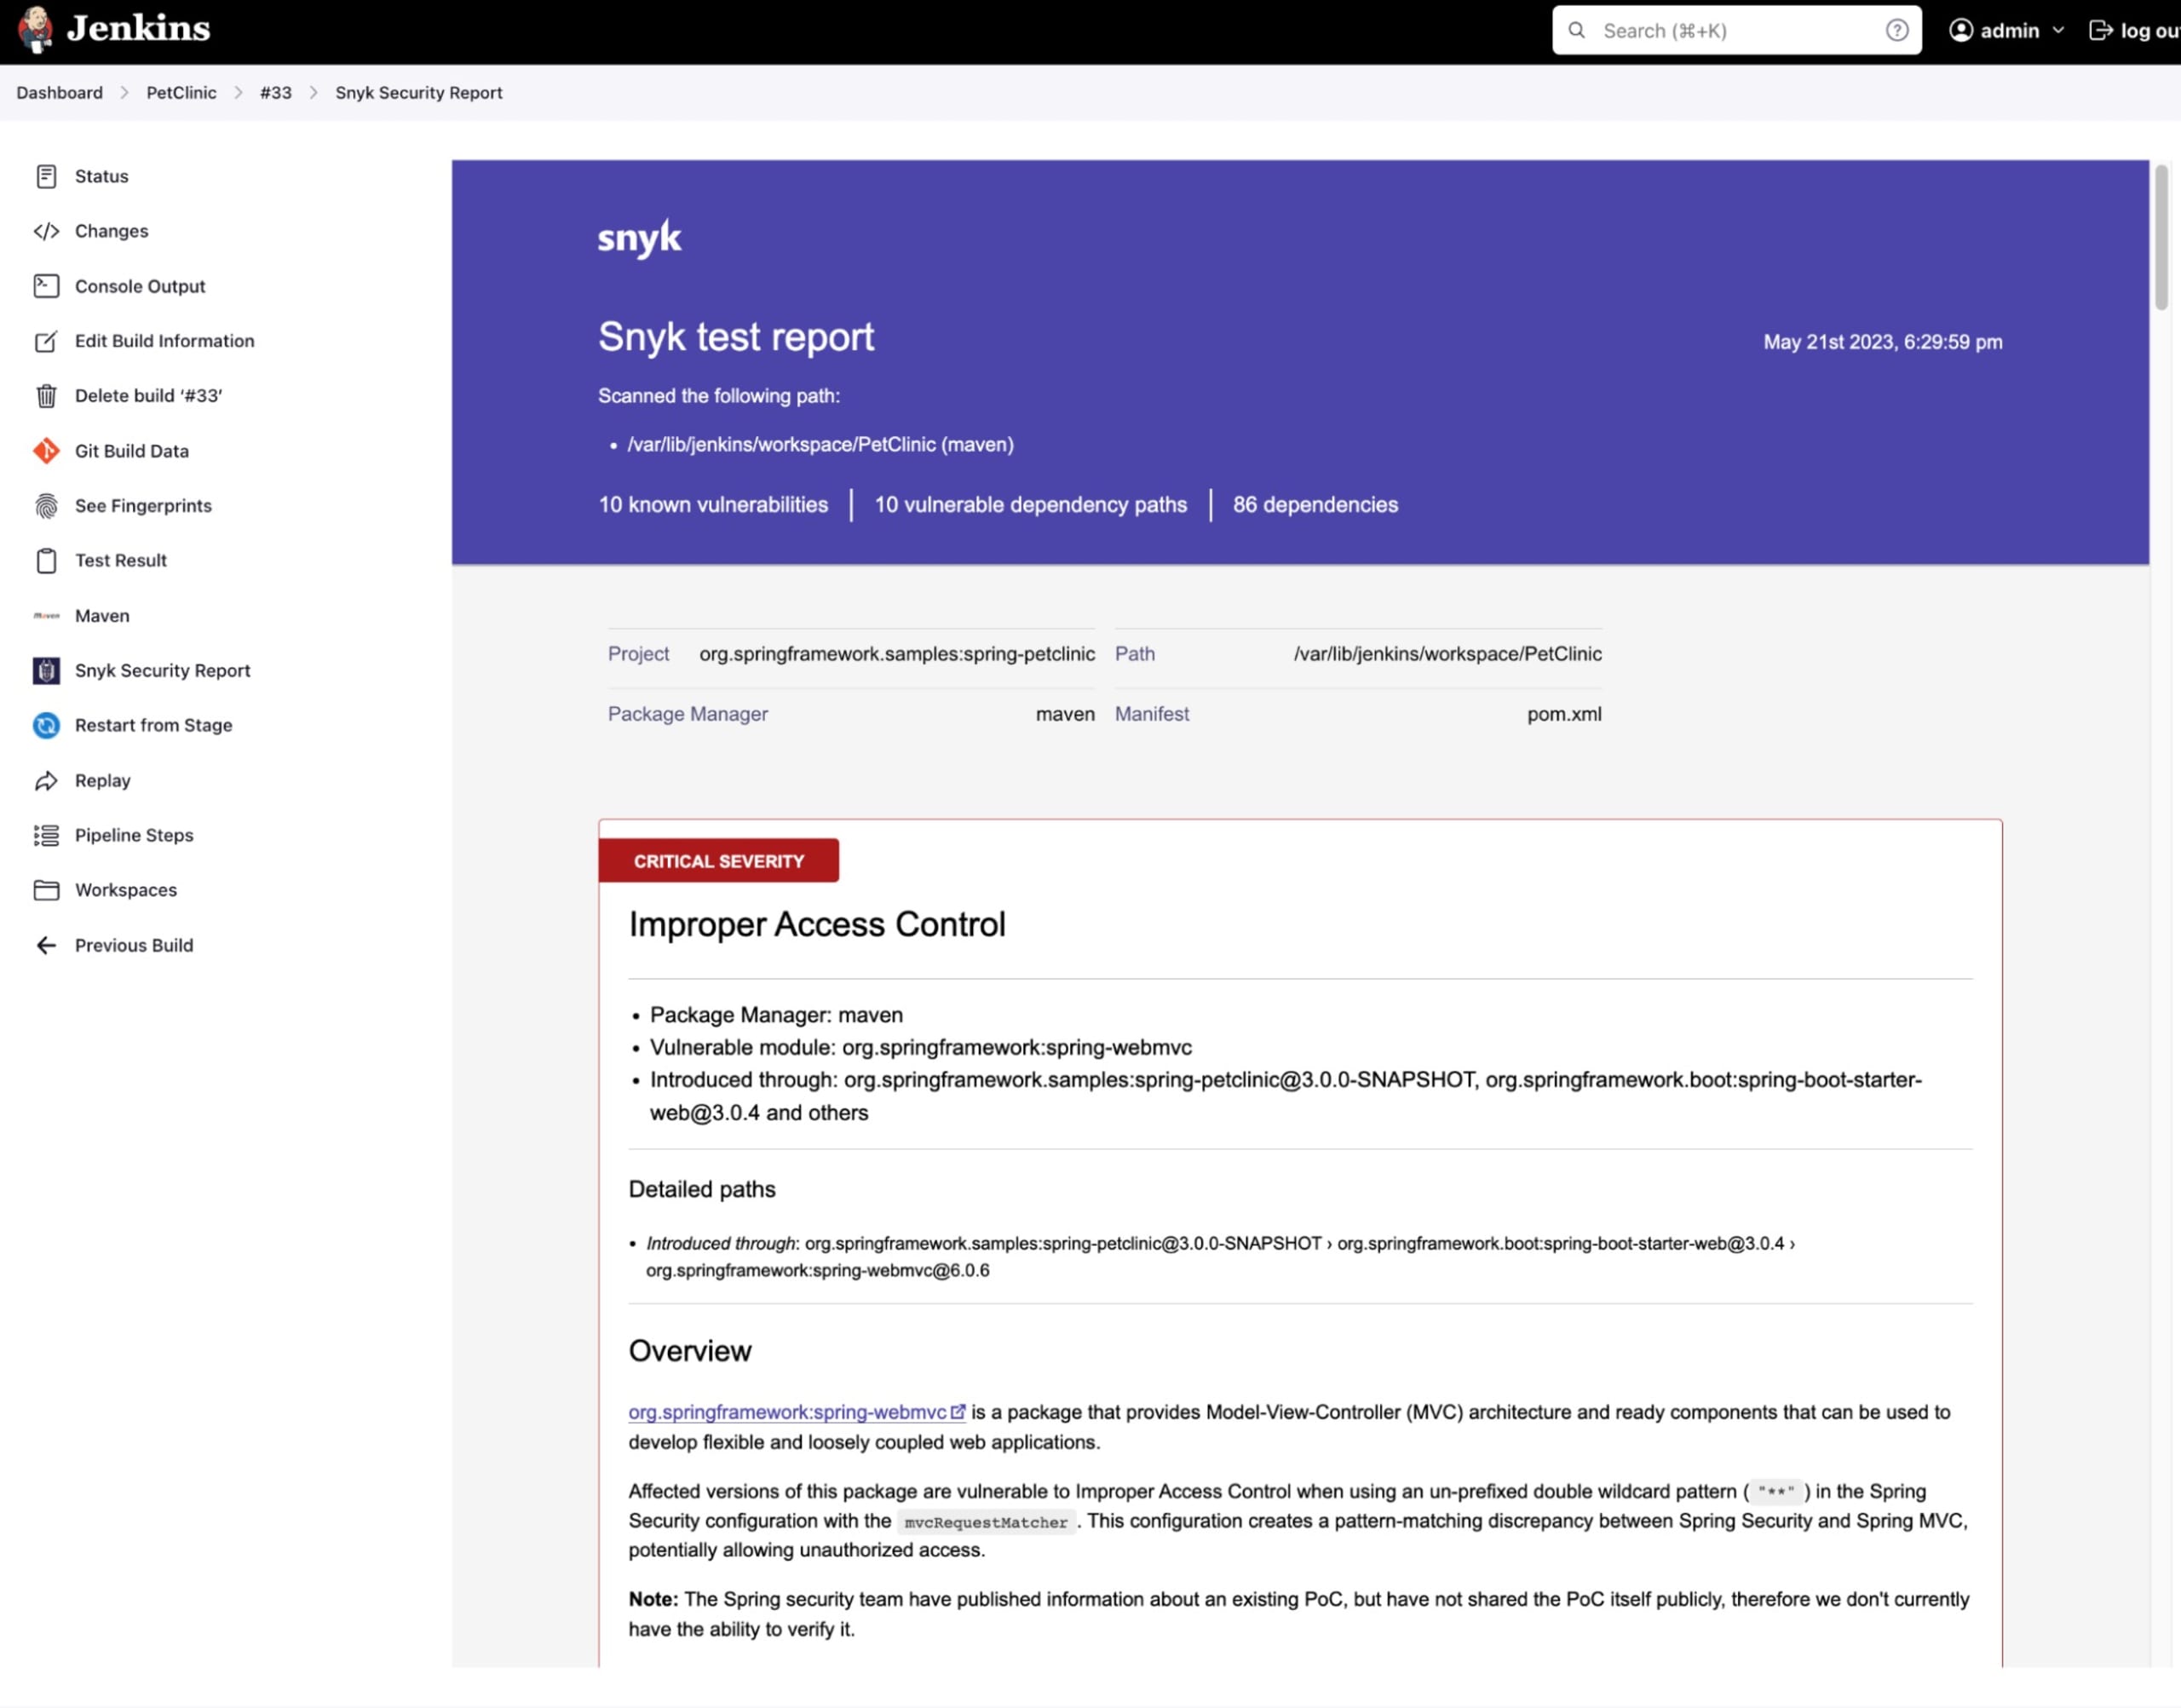
A list of report date stamps will be presented (often with just one unless you configure multiple scans per job). Click on it to see the formatted report page.
Example 1b: Using Snyk in Jenkins Freestyle projects
Similar to the Jenkins Pipeline example, in a Freestyle-type project you will add the Snyk scanning step as a build step where it makes sense for your project. Assuming you’ve configured your Jenkins Snyk plugin as discussed above, go to your project configuration page, click “Add build step” where you want the scan to be done, and select the “Invoke Snyk Security task” list item.
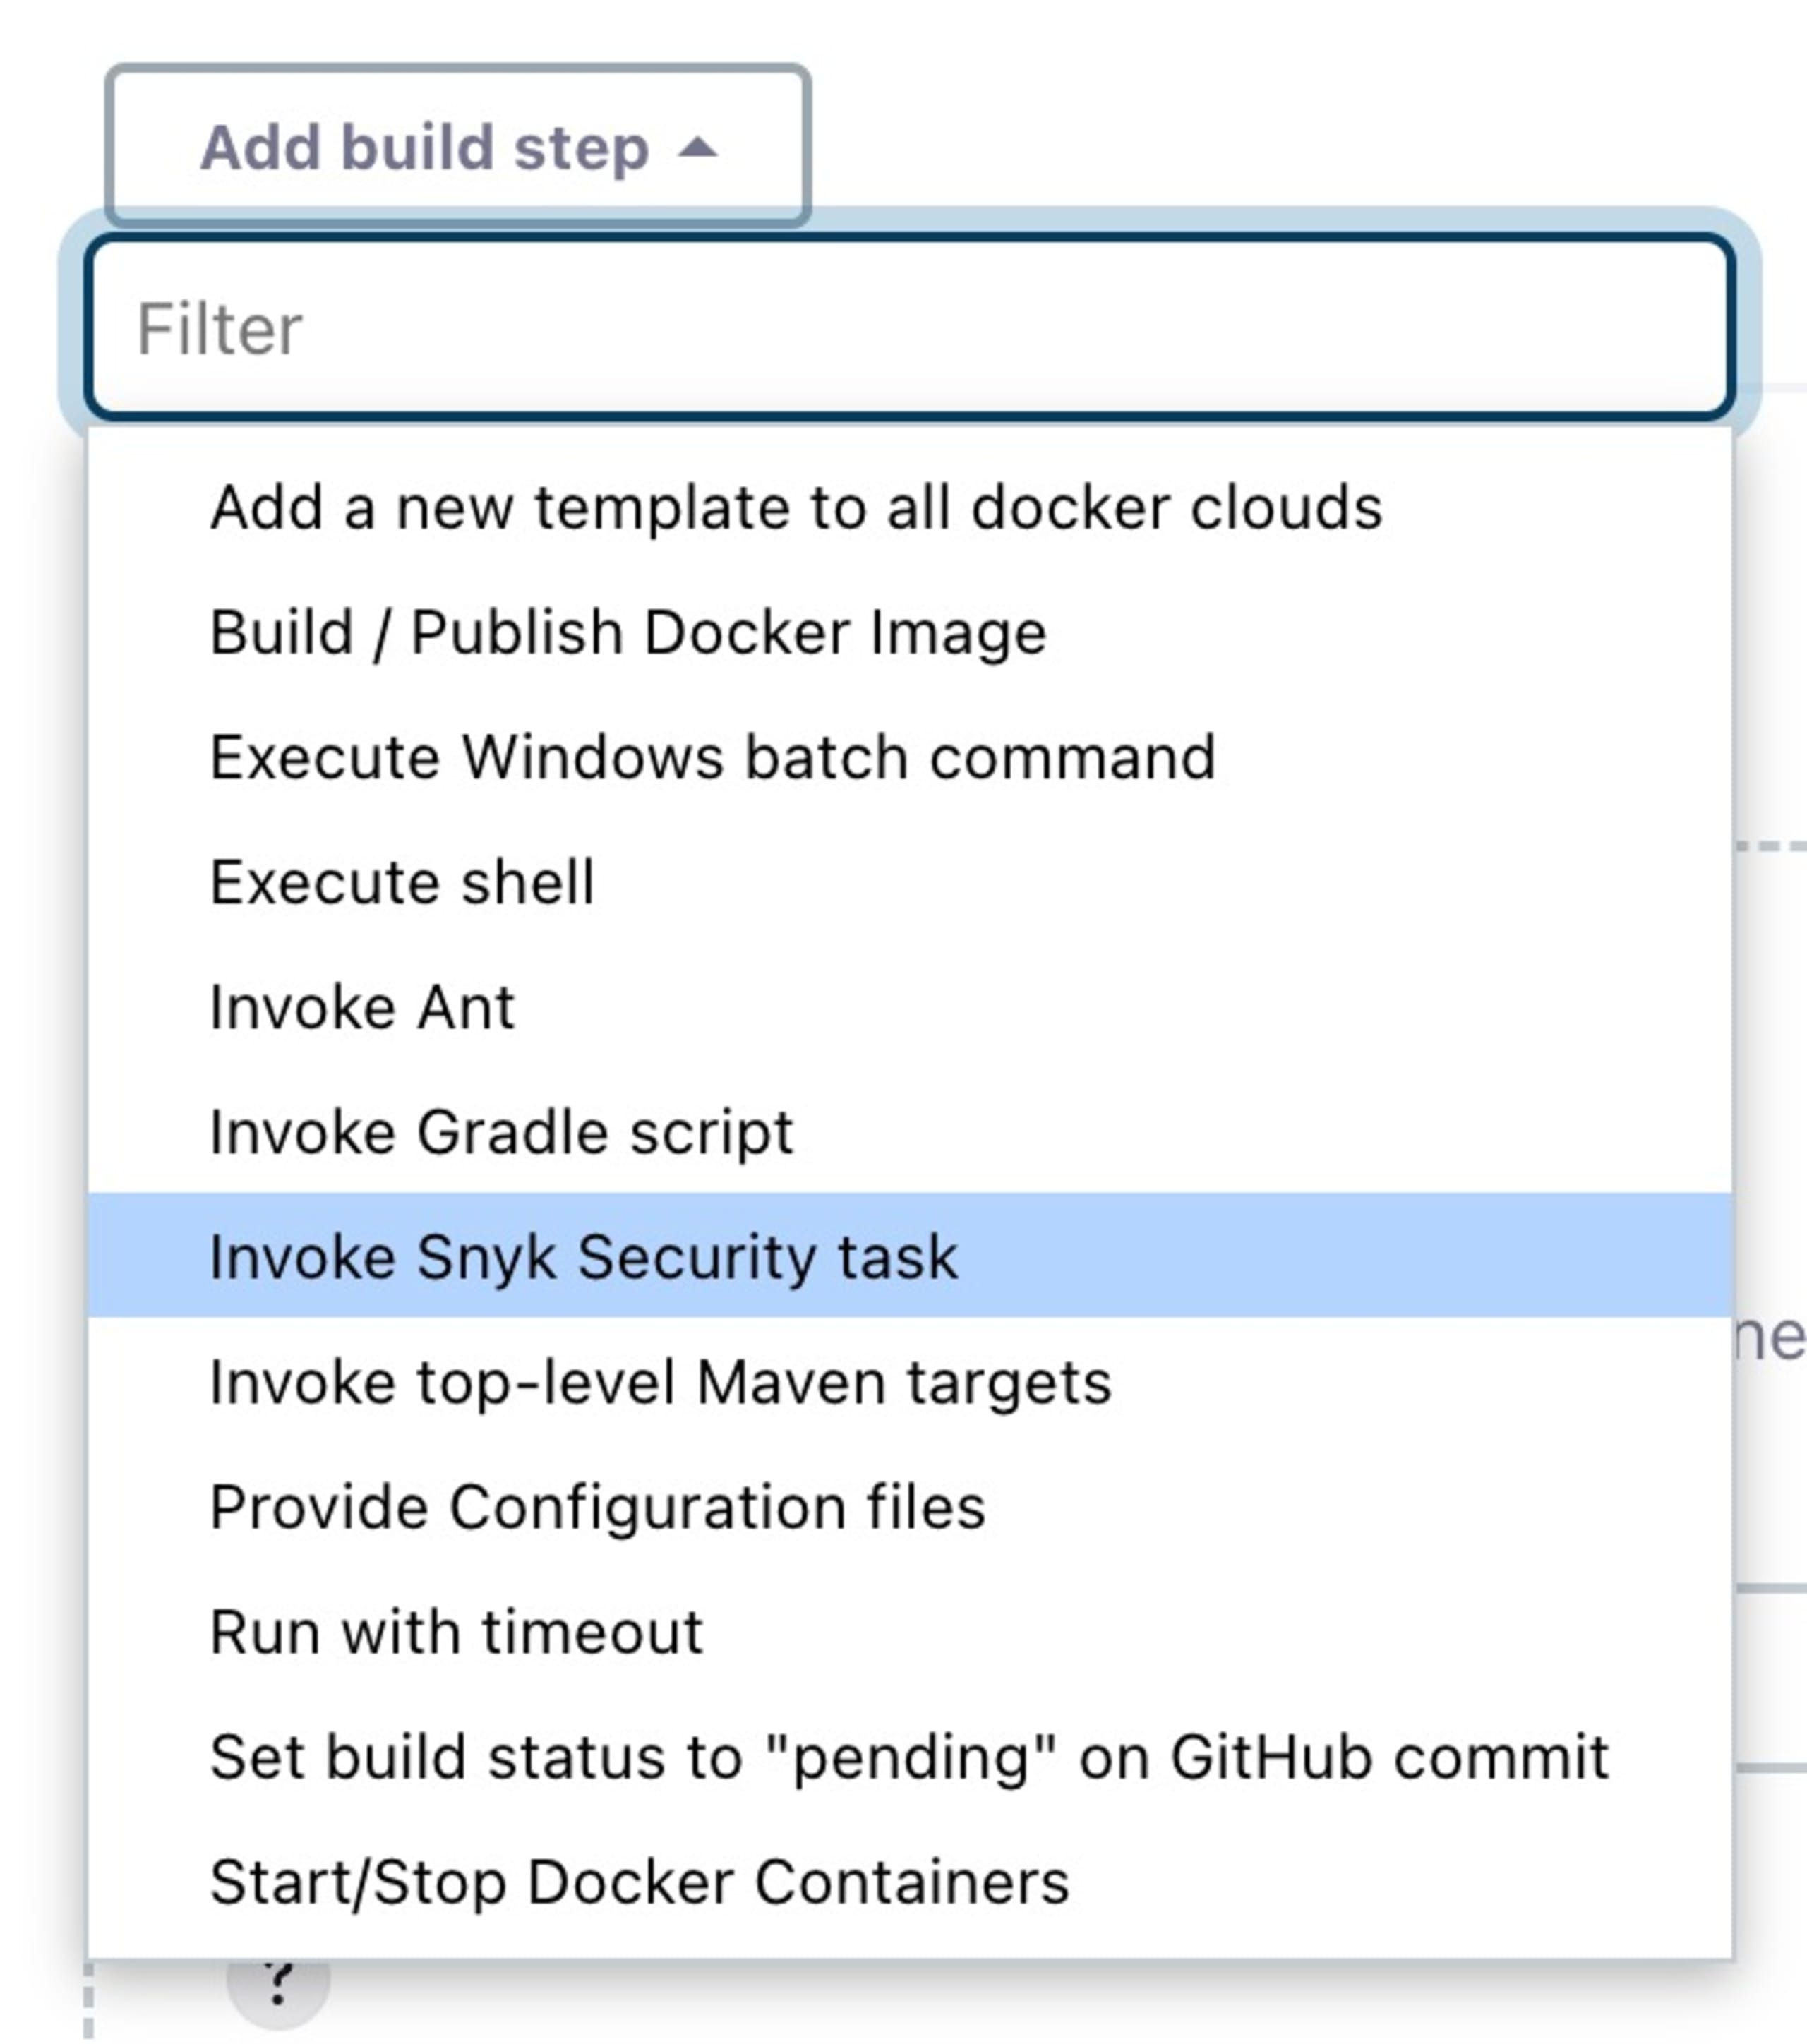
Note: The list of build step types in this menu will vary depending on what plugins and tools are configured in your Jenkins server.
Next, fill in the “Invoke Snyk Security task” configuration form as needed. In this example, I’ve checked the “Let the build continue” option for what to do “When issues are found”, which is the equivalent of using the failOnIssues: false option in the earlier pipeline example.
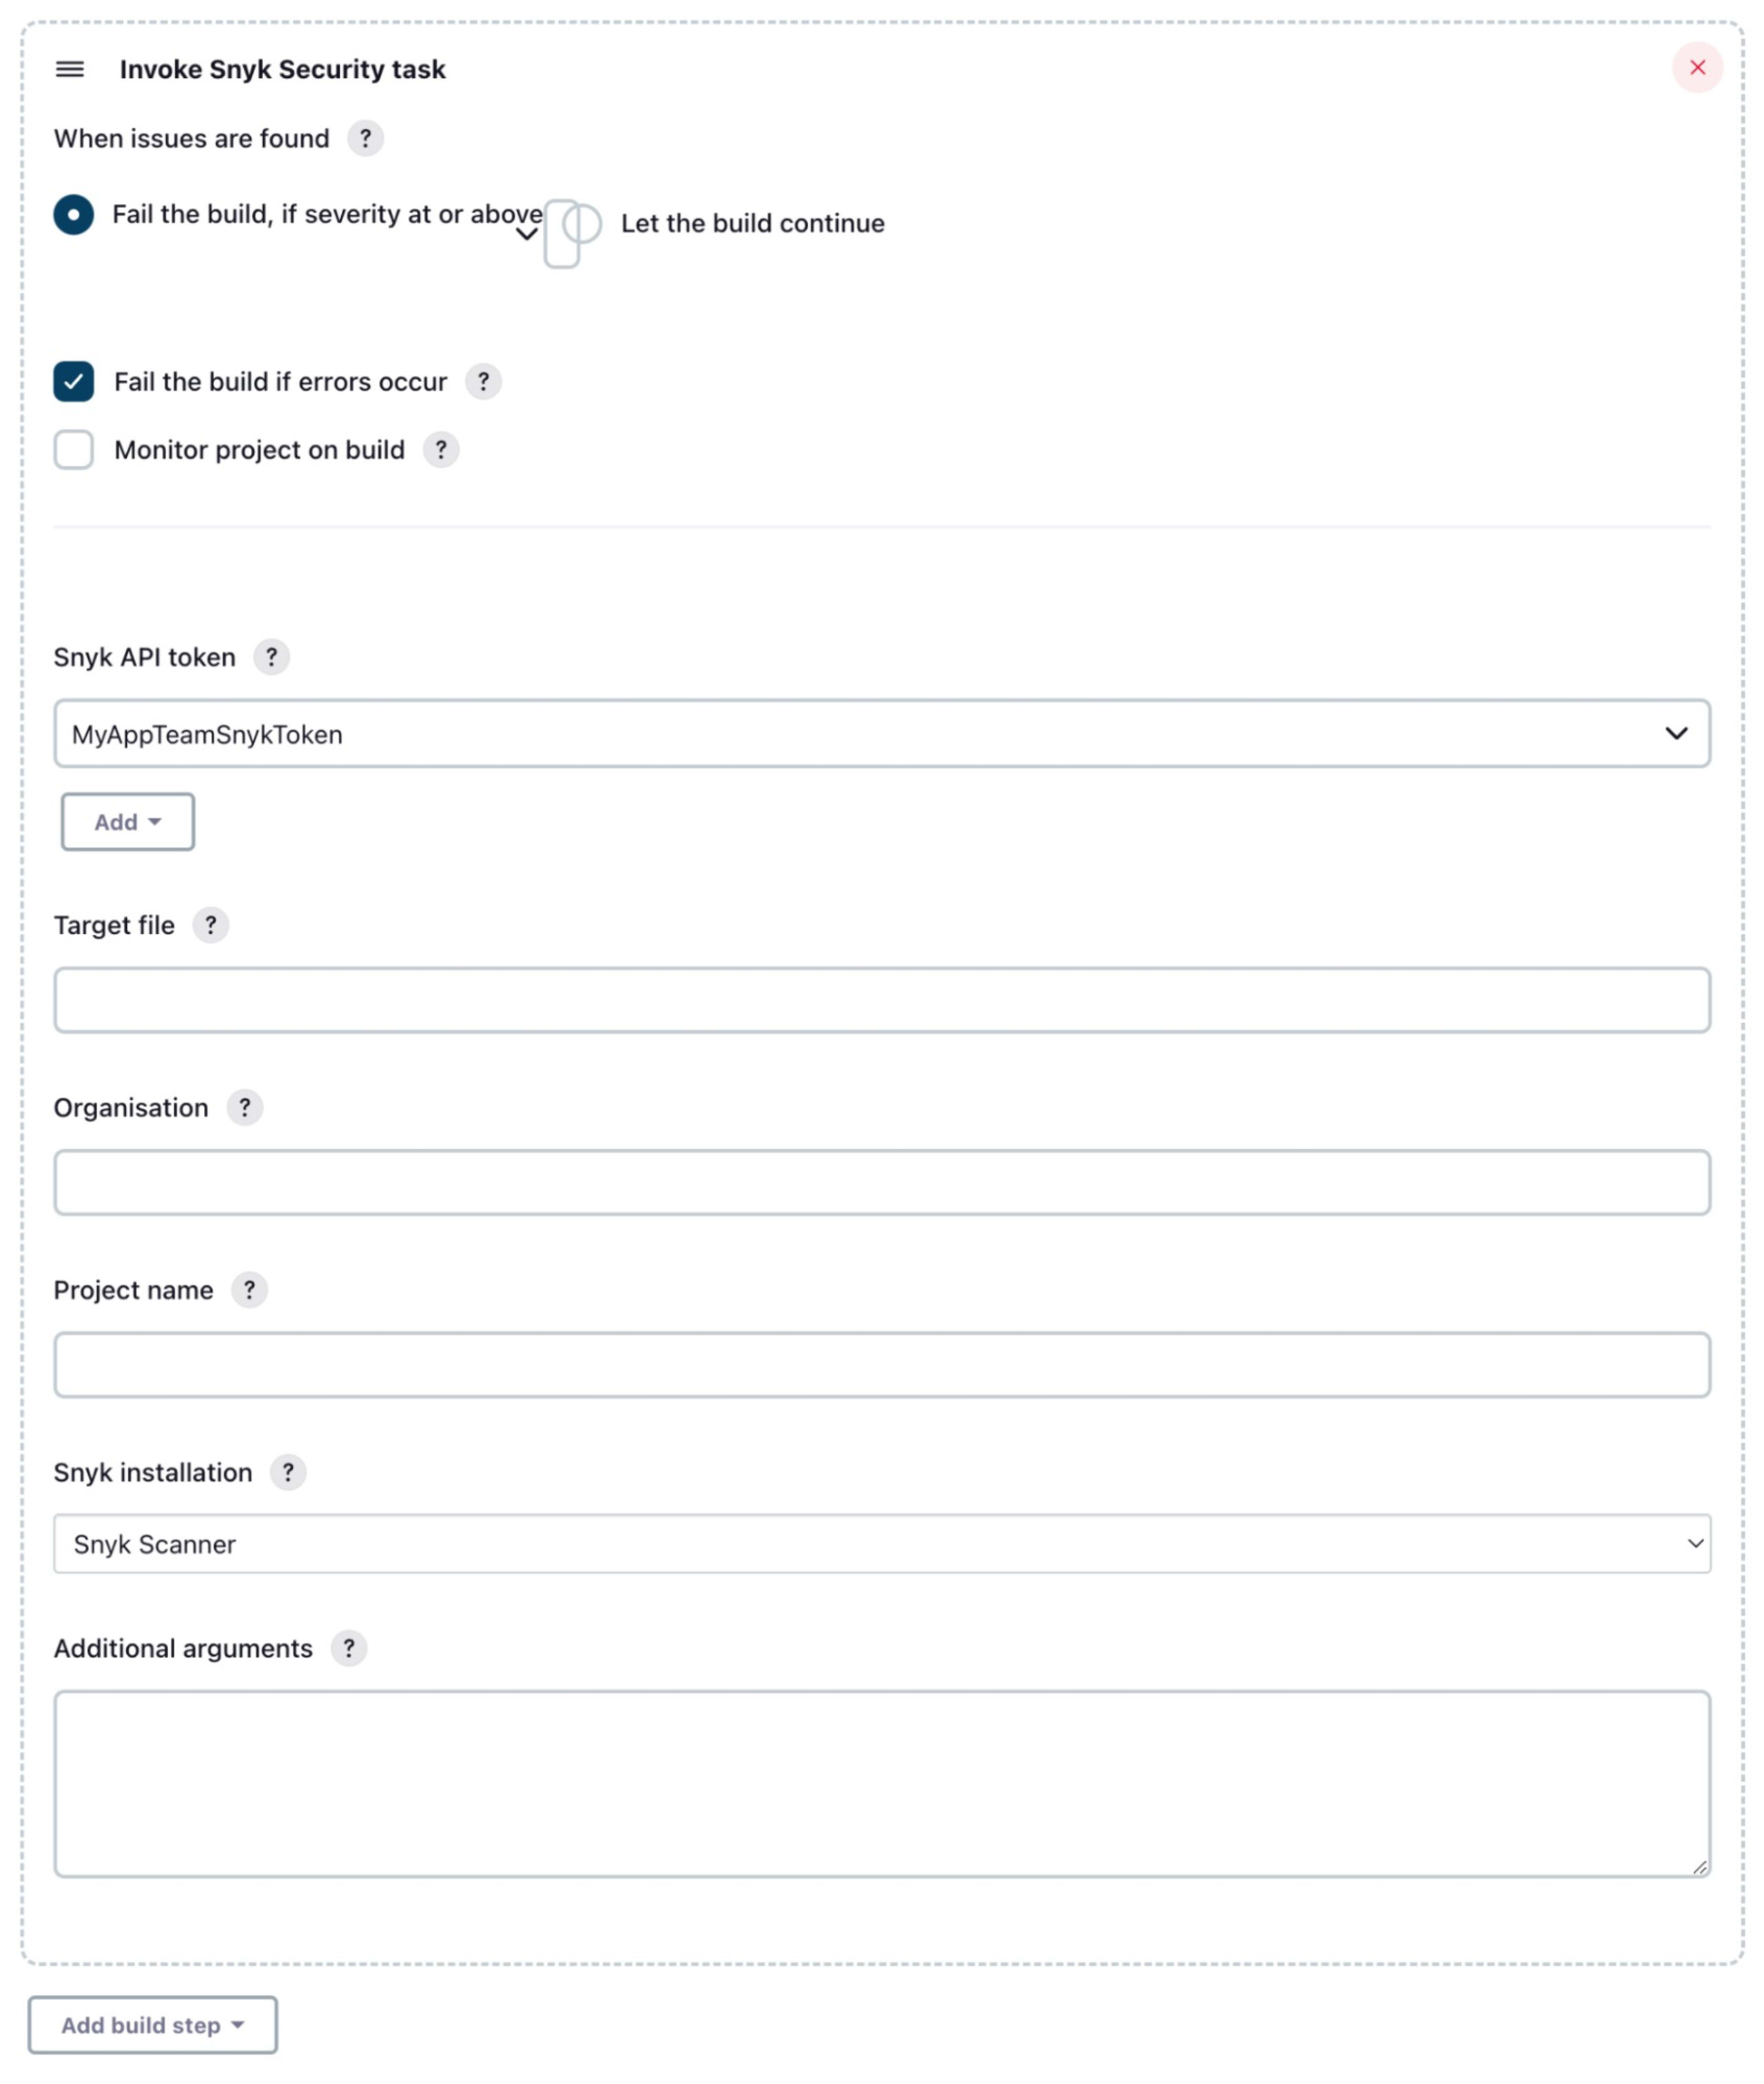
The same Snyk Security Report we saw in the pipeline example will be available on the build page.
Example 2: Snyk GitHub Actions
Probably the simplest way to get Snyk scanning set up for GitHub Actions is to add a workflow with a couple of steps using existing GitHub actions. Here is a simple example of an application workflow that runs a Snyk Open Source scan using the snyk/actions/setup action and then uploads the results into the GitHub repository’s “Code Scanning” page using the github/codeql-action/upload-sarif action. This file would be saved in your repository under a path like .github/workflows/snyk-test-sarif.yml. Also, be sure to add your Snyk auth token to your repository secrets as “SNYK_TOKEN” — or if you use a different name, be sure the workflow yaml is updated to match.
Note that we configured the snyk test command to output in SARIF format, which is directly importable by GitHub and will allow us to see the results in the native GitHub interface. After running this workflow, you can navigate to the repository’s Security tab and then open the Code Scanning page from the menu on the left.
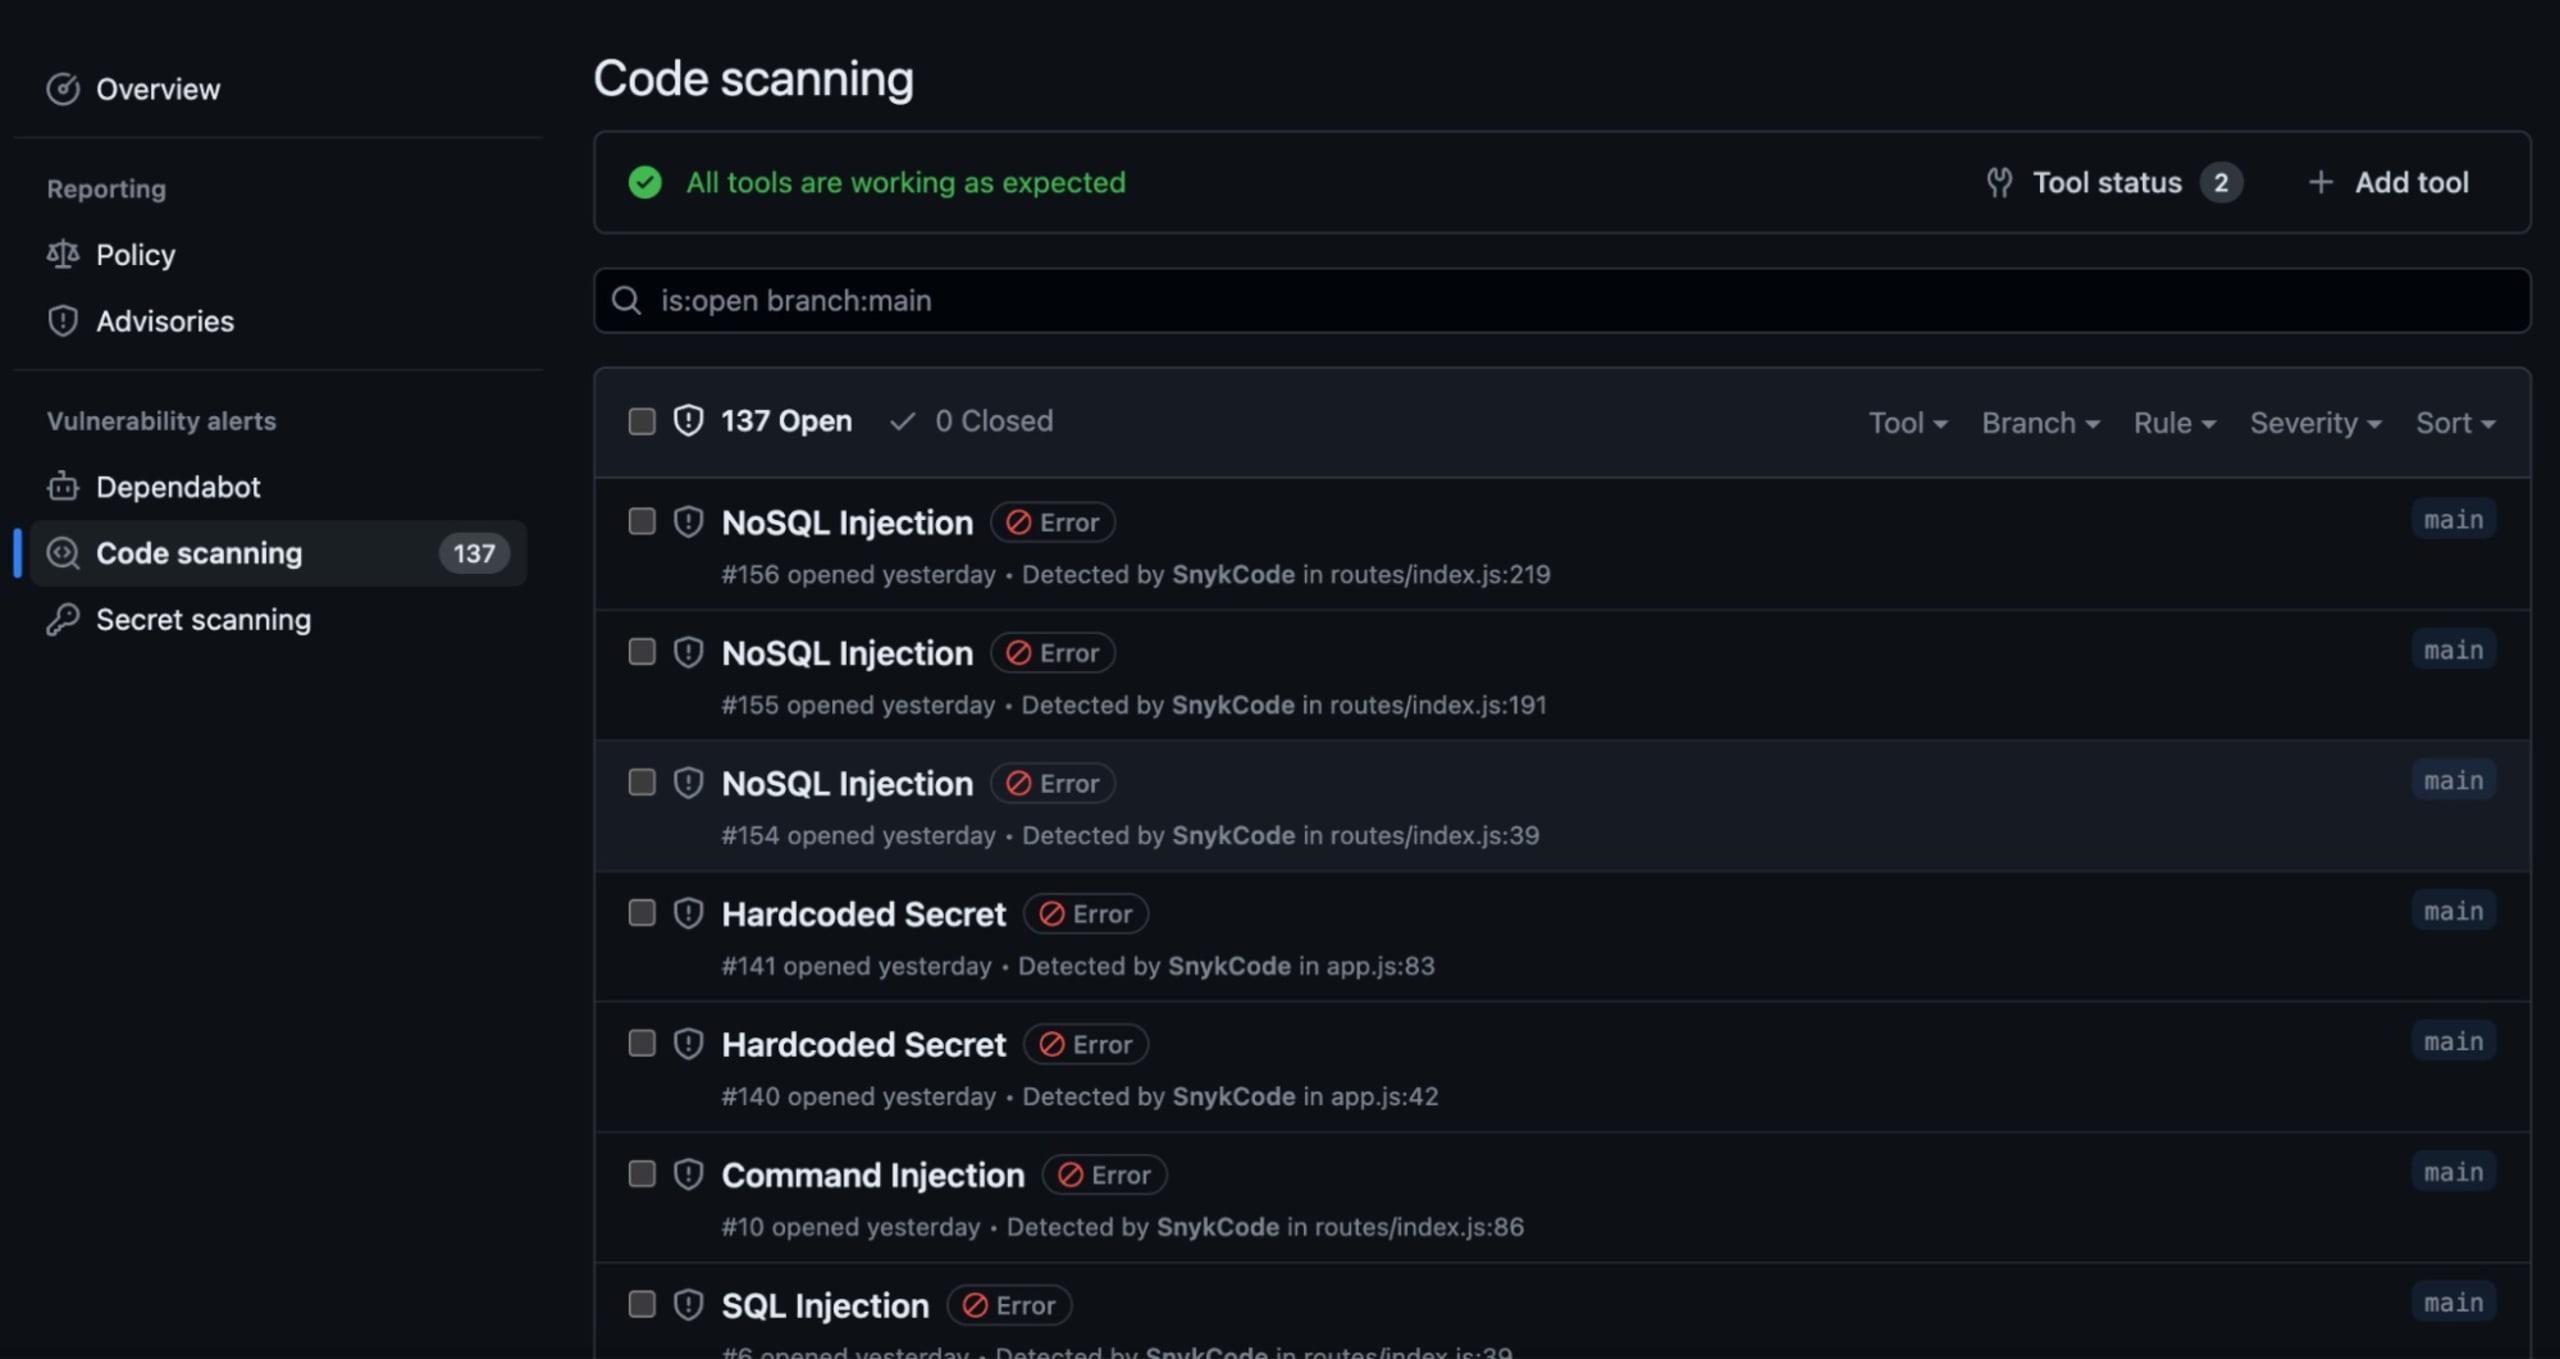
You also can see the Snyk CLI output in the action logs as well.
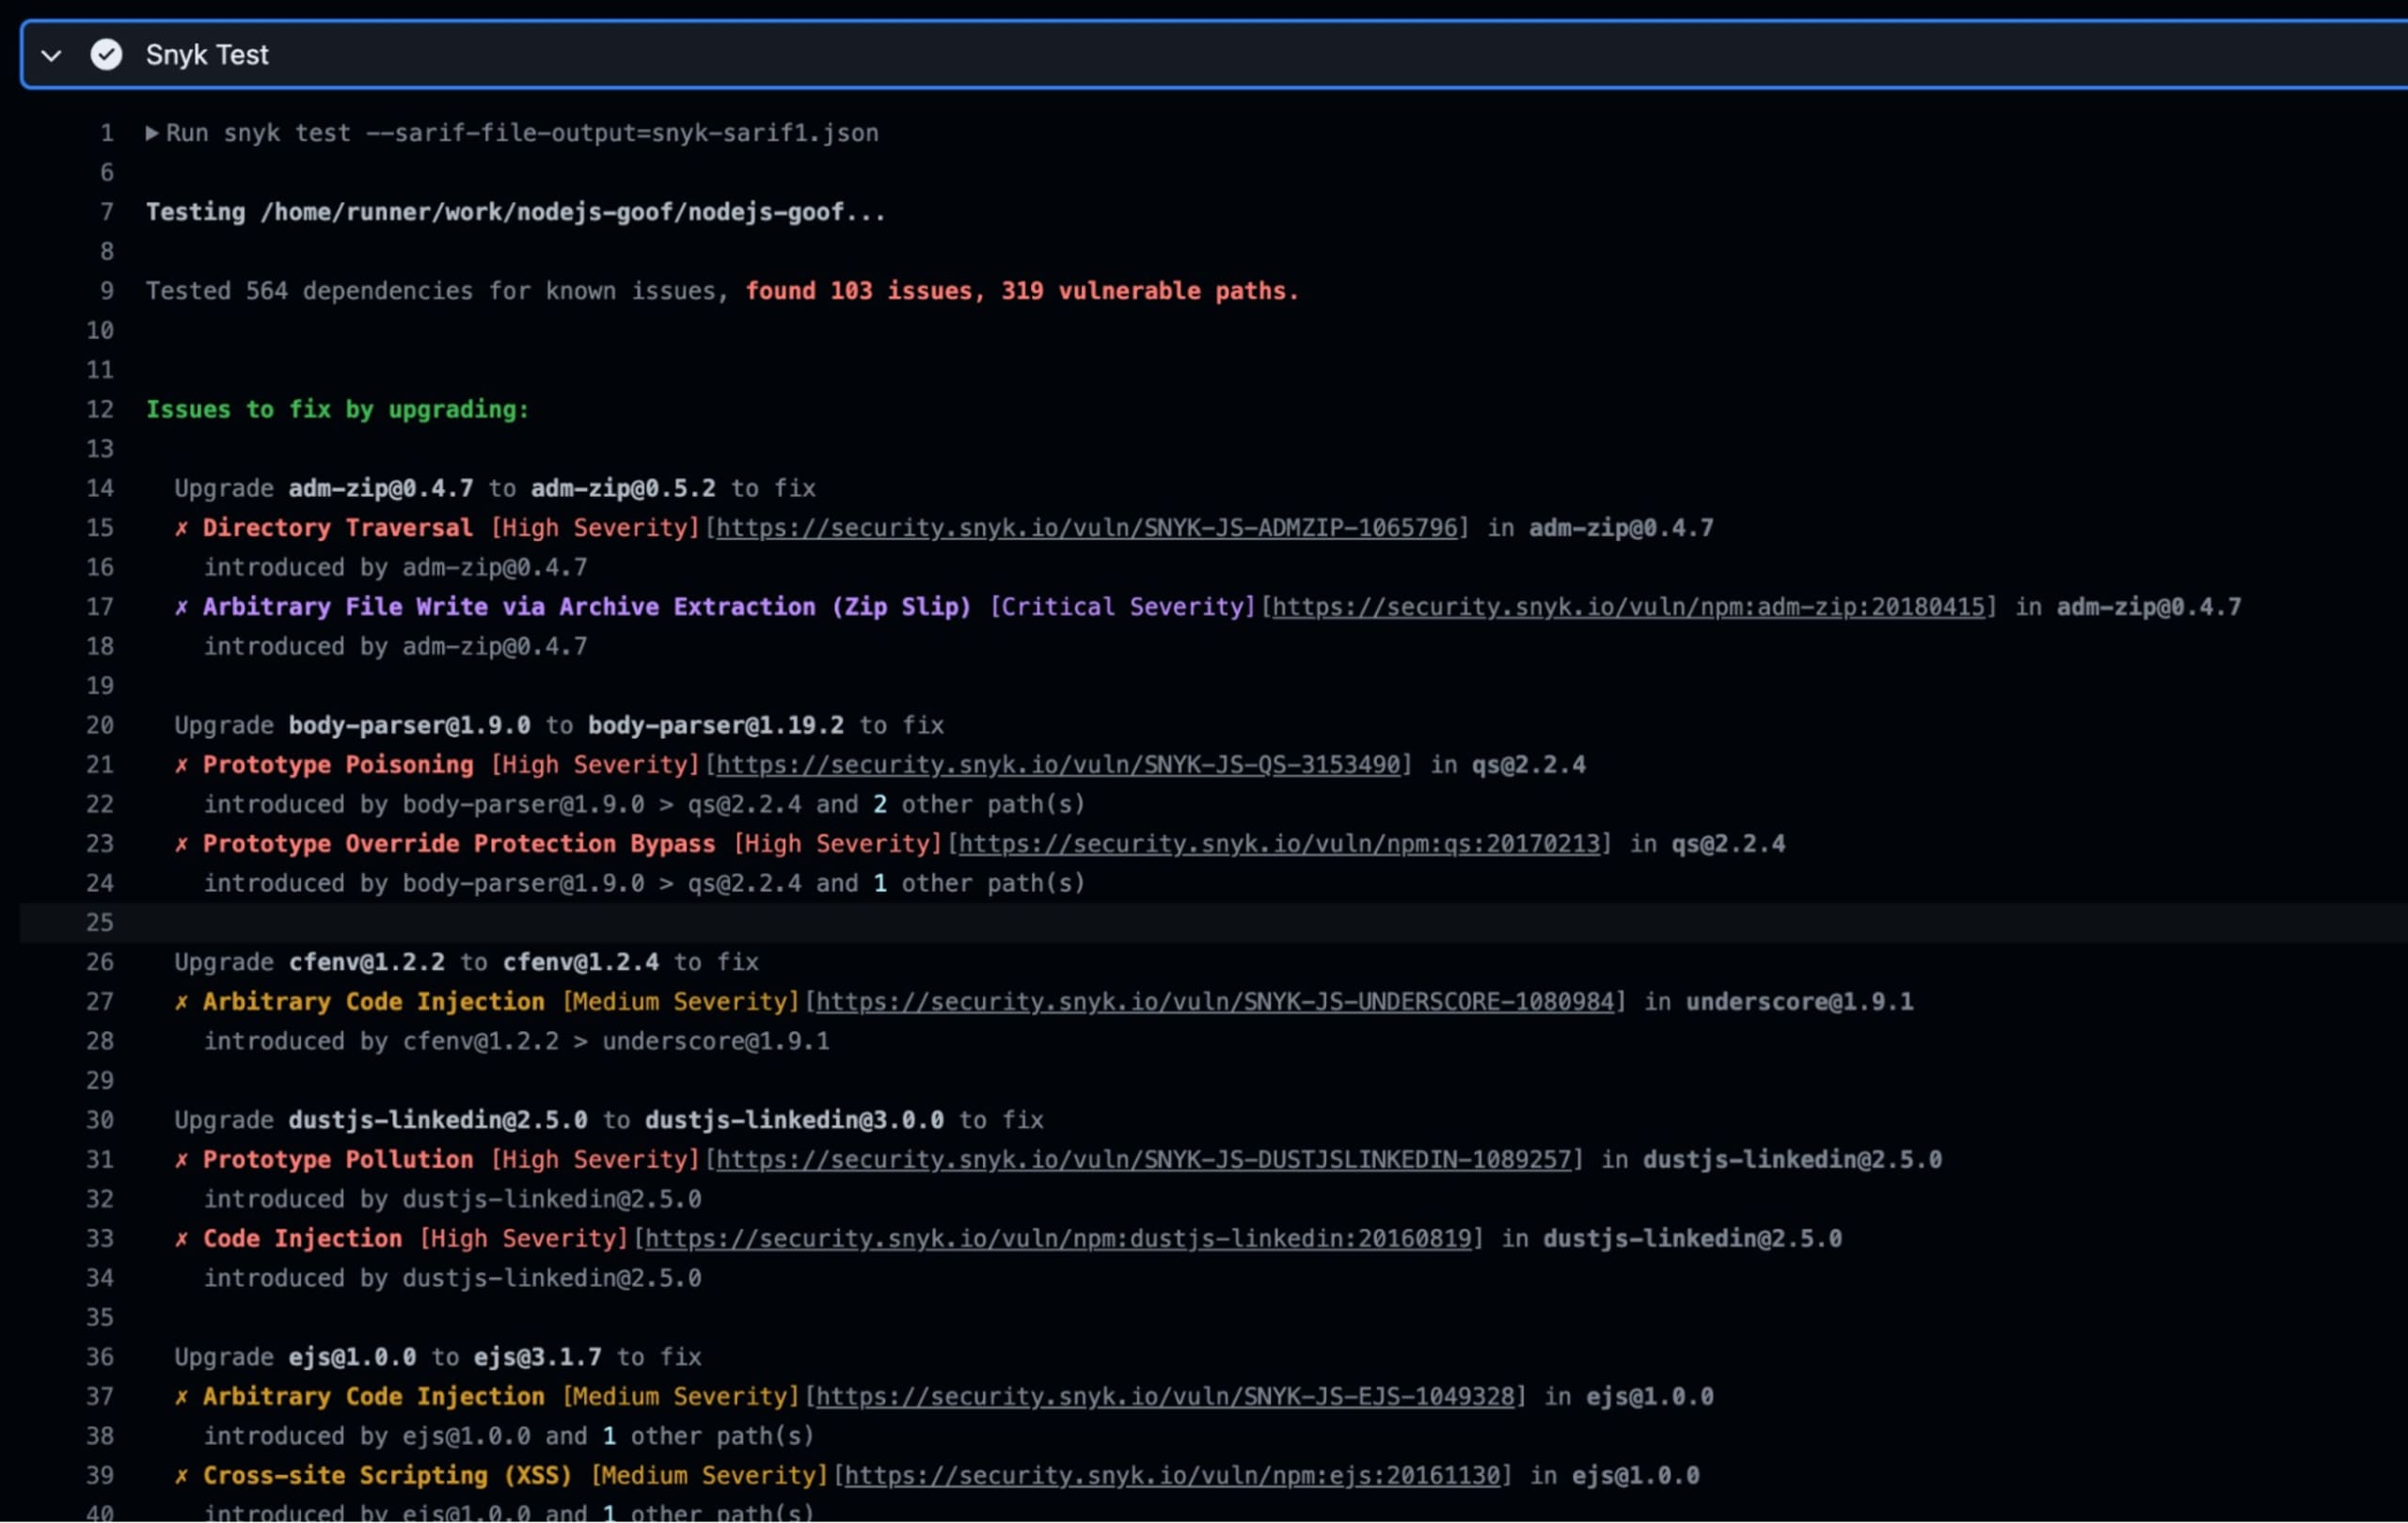
This example used the snyk/actions/setup action, which allows you to run the Snyk CLI scanner from a shell command and will work for most use cases. There are, however, dozens of other versions of the action tailored to specific languages. Build tools and use cases along with their usage instructions in this GitHub repo: https://github.com/snyk/actions
Finally, if you are working on Java projects, check out this blog article from Snyk Staff Developer Advocate, Brian Vermeer where he deep dives into setting up Snyk for Java applications in GitHub: Building a secure CI/CD pipeline with GitHub Actions for your Java Application.
Example 3: Using Snyk container images
Sometimes, installing the Snyk tooling — whether via a CI plugin or pre-installed on your CI build nodes — is not an option, as many CI clusters want their build nodes to be as generic as possible. In these cases, build and test tools such as Maven, npm, Cucumber, etc., are often utilized via a container runtime such as Docker, where the build steps run inside an ephemeral container just for that job. There are many benefits to this, not the least of which is that it allows development teams to use their specific, container-hosted solutions without conflicting with tools used by other teams on the same build clusters. To support such practices, Snyk publishes a collection of images on DockerHub containing the latest version of the Snyk CLI pre-installed and the packages needed for many different languages and platforms. The image repository snyk/snyk has dozens of image tags ranging from basic Linux-based ones to any language Snyk can scan — such as Python, Java, and Node.js — along with various versions of each. There is even a docker tag that includes the Docker CLI, which can be useful for Snyk Container scanning.
Using these in a tool like Jenkins requires container support and access to a registry with the snyk/snyk image repository. However, if you’re using container build steps, this would already be configured on your server. So you can add something like this to your Jenkinsfile:
Note: Some assumptions made for the above Jenkinsfile snippet:
Jenkins Credentials Binding Plugin is installed for the
credentials()call to work. This is one of the default plugins most Jenkins servers are installed with.Snyk auth token is stored in a Jenkins secret credential named “SNYK_TOKEN”.
Jenkins Docker Pipeline plugin is installed, and a docker runtime is available on the Jenkins server build node.
Also, notice the || true in the last sh line where we run the Snyk CLI, the equivalent of the failOnIssues: false setting demonstrated in the Jenkins plugin section above. Remove that part of the command if you want your pipeline to fail upon finding any vulnerabilities.
9. Continuous monitoring
Using Snyk scanning to fail your pipeline and/or PR is a valuable practice, but what about new vulnerabilities found in dependencies after running that scan? Even though the next pipeline run will catch it, that might not happen immediately, and your application could be deployed with known vulnerabilities — which you would not be alerted to until the next build. Snyk monitoring creates a project in your Snyk account to be continuously monitored for open source vulnerabilities and license issues. This works by uploading the bill of materials (BOM) containing the graph of your application’s dependencies to Snyk’s servers for continuous monitoring. If a new CVE is opened against any of your projects, an alert is sent to your team. And if a fix is available by upgrading the impacted dependency, a PR to your project with the recommended fix can be opened automatically by Snyk.
Monitoring with Jenkins Plugin
Enabling this feature is very simple in Jenkins. In fact, it’s the default for the Snyk Jenkins plugin for both Pipeline and Freestyle-type projects. Simply remove the monitorProjectOnBuild option (or set it to “true”) in your Jenkinsfile step, or ensure the “Monitor project on build” setting in your Freestyle build step is selected.
After a build run is complete, check the console log for a section like this:
Opening the URL given will take you to your Snyk project where you can see expanded information about your project report, and daily checks will begin with alert emails sent to your organization if/when new vulnerabilities are discovered.
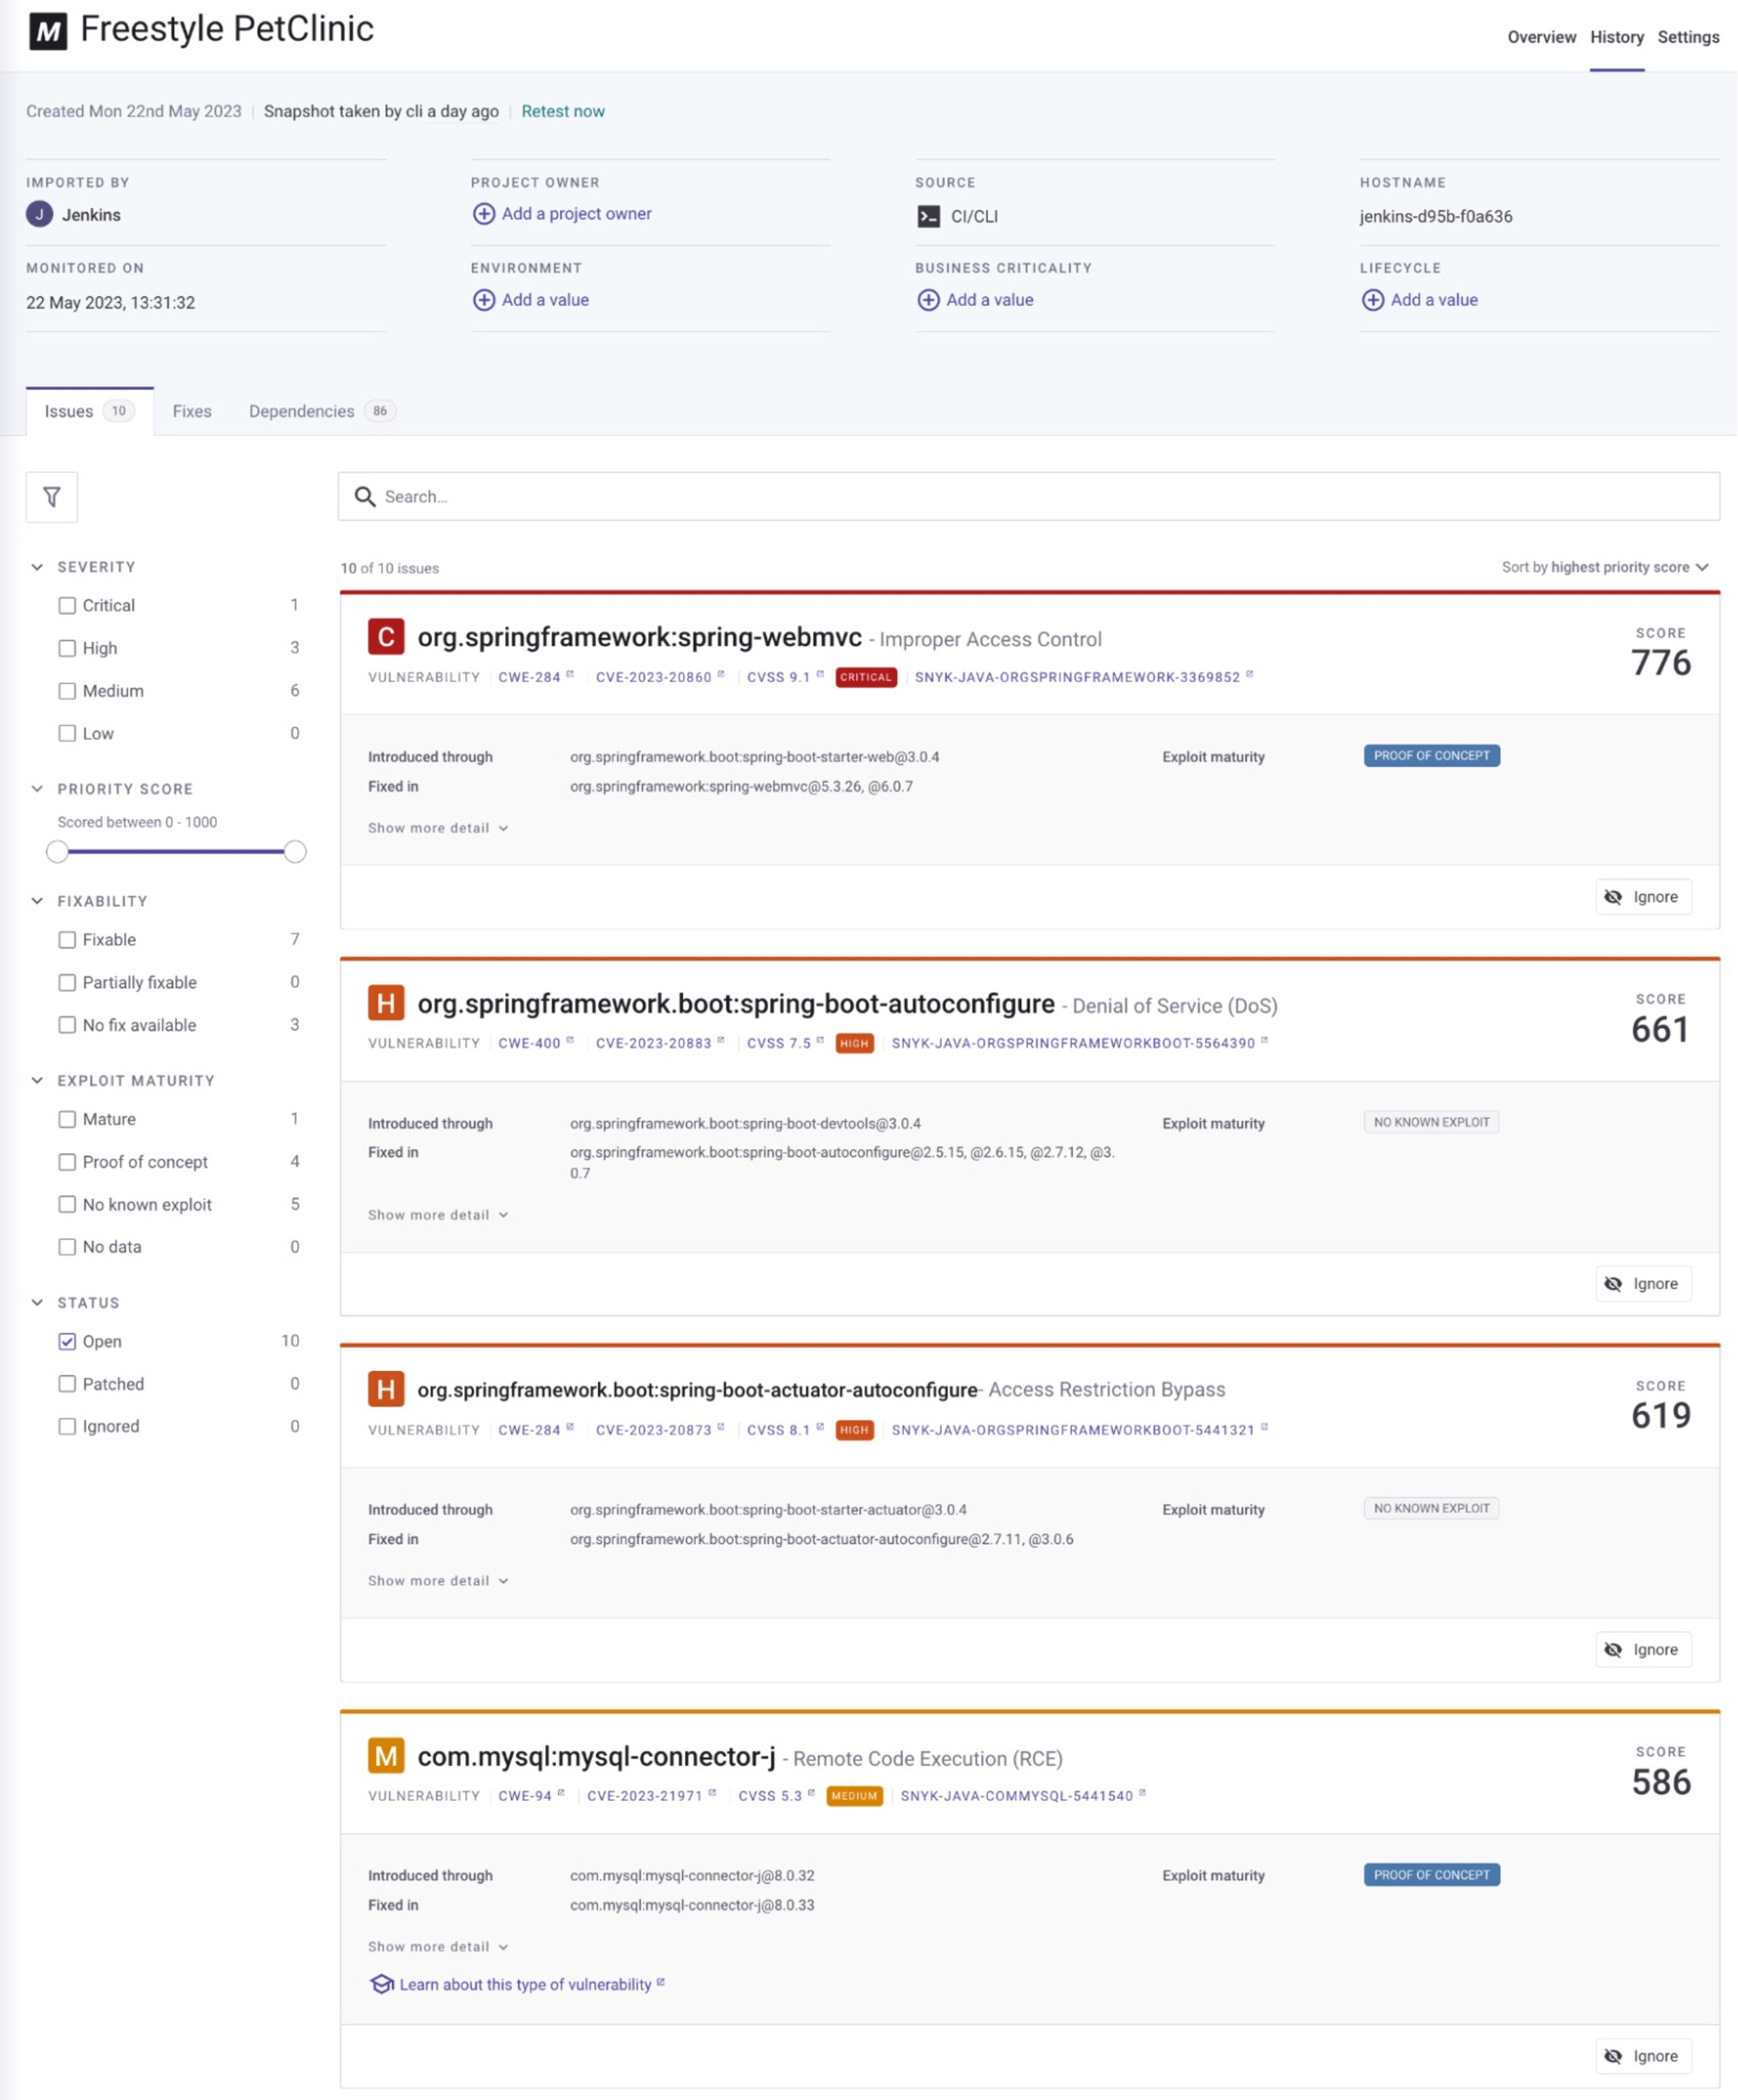
By default, a project name will be auto-generated based on the project being scanned. If you would like to override this — a common request, especially if you have multiple CI jobs building the same project and Snyk organization — you can set the Project name explicitly. For example, in a Jenkins project, you can use the “$JOB_NAME” as it’s value.
Monitoring in GitHub Actions
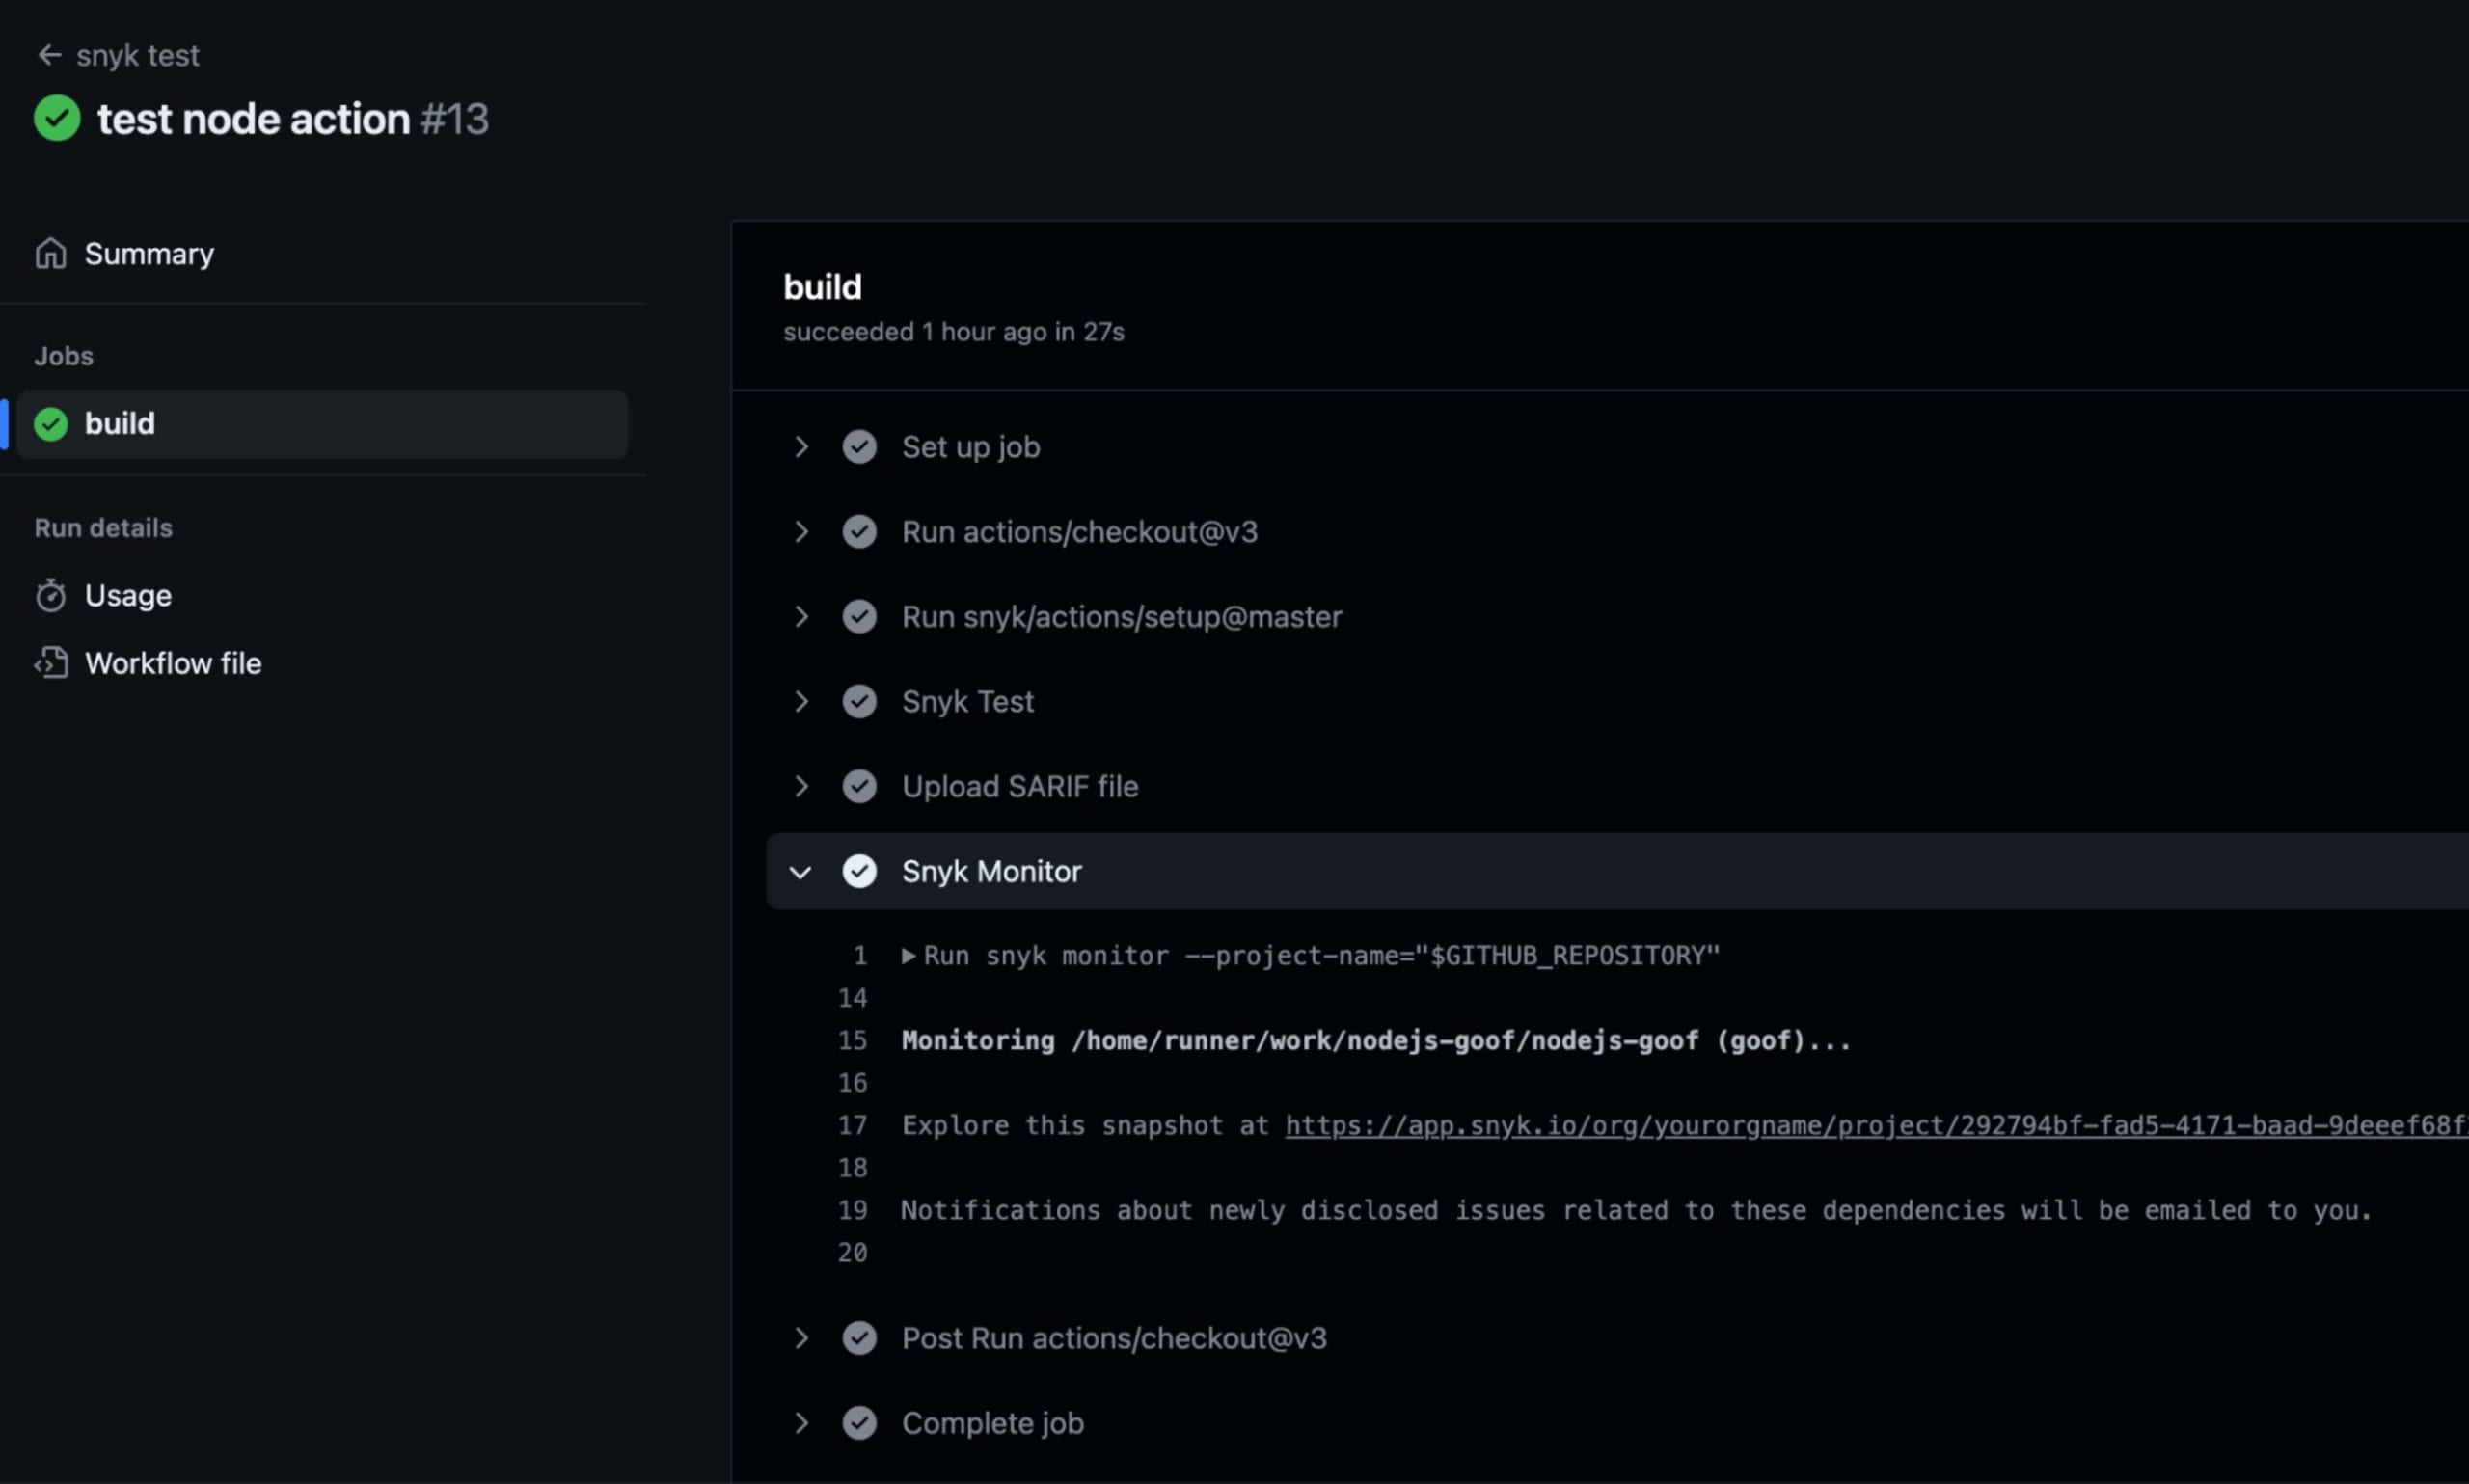
The Snyk GitHub actions do not automatically set up monitoring as the Jenkins plugin does, but adding it simply requires another step — either in the same workflow or its own — that runs the monitor command. Extending the above GitHub example YAML, you could simply add a block like this to run the monitor and create a Snyk Project named after the GitHub repository.
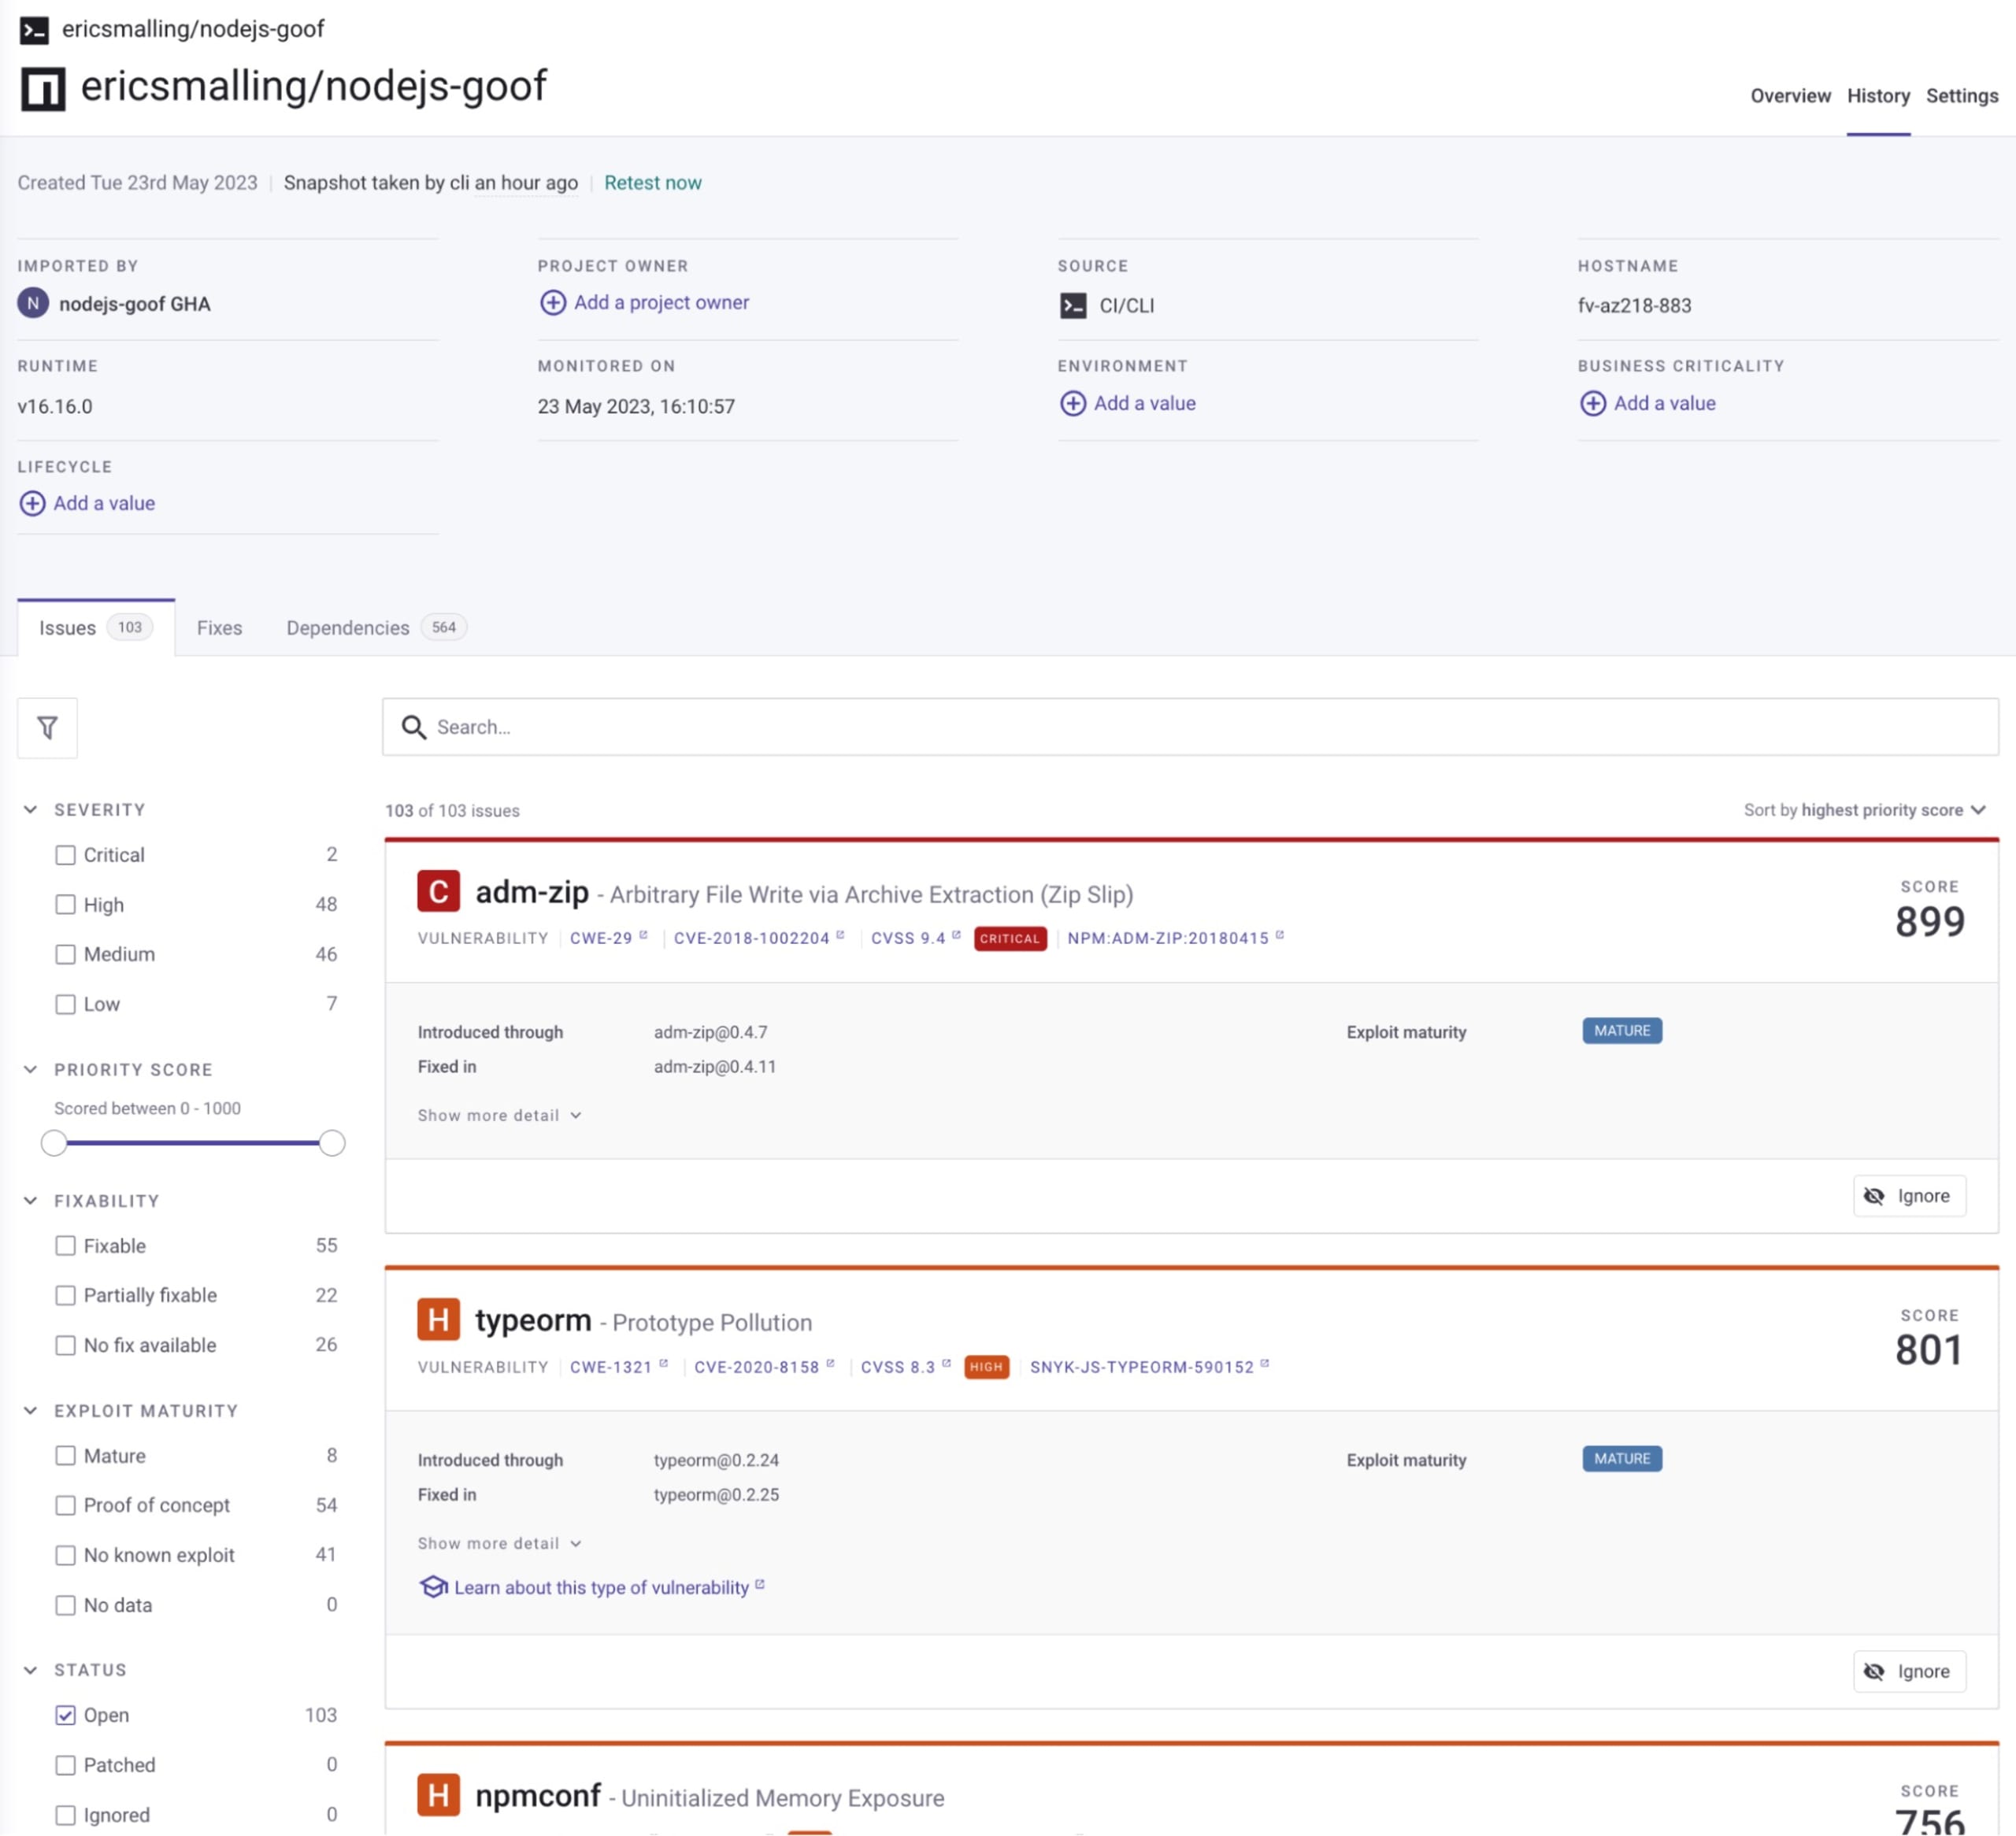
Once the workflow runs, you can open that step, and the URL for the new project will be visible in the logs.
Click on that URL, and you’ll see the Snyk project in your account.
Conclusion
Whether it be code compilation and unit test failures or vulnerabilities and misconfigured YAML, there’s a lot you can do in your CI/CD pipeline to harden your applications and their infrastructure definitions, and the sooner your catch issues, the better. We hope these 8 topics will help empower your teams to continue to develop fast and stay secure!