Quer experimentar?
Measuring your Cloud Native Application Security Program
Steps towards measuring your cloud native application security posture
"Successfully launching any security program requires a solid metrics strategy. Gaining visibility into cloud-native security can be particularly complex. So understanding what metrics are most meaningful and how they relate is critical."
- Alyssa Miller, Application Security Advocate
Introduction
Through working with various security and engineering leaders across various industries, a key theme emerges when we talk about the security of cloud-native technology. Understanding which metrics are most meaningful and how to gather them is a struggle for most organizations. Traditional security metrics and KPIs tend to be arbitrary in nature and don’t translate well to the dynamics of DevSecOps pipelines that are often at the foundation of a cloud transformation. In this guide, we define a new approach to collecting cloud native security metrics as well as interpreting them in a more effective and actionable way.
As you make your way through this white paper, you find a model for constructing and interpreting software security metrics in a cloud-native world. A key deficiency of many approaches to software security metrics is that each element is considered in an isolated fashion. Where this new model differs is in our analysis of how key metrics that drive our KPIs relate to each other. For instance, looking at how a numerical increase in one metric could be interpreted as a positive or a negative when considered in context of related data points.
Why we’re releasing this white paper
Open source software, DevSecOps delivery, and cloud native application security are at the core of everything we do. For years Snyk has been building developer-first tools that ensure software engineers and architects are enabled with frictionless tooling that allows them to use open source and cloud native technologies securely. However, we understand that DevSecOps isn’t about tools but rather it’s about culture. That requires comprehensive programs that incorporate people, process, technology, and governance. It’s the governance component that presents a particular challenge.
Therefore, in order to build on our commitment of helping the security and cloud native communities to mature and grow, we’ve developed this metrics model to provide clear guidance on how to visualize and measure the security posture of a cloud native application security program. As always we’re happy to answer any questions you may have or discuss how we can be of additional assistance to your cloud transformation journey. Please email us at info@snyk.io to continue the conversation.
Amado por desenvolvedores, confiável por segurança
As ferramentas da Snyk com foco nos desenvolvedores oferecem segurança integrada e automatizada que atende aos seus requisitos de governança e conformidade.
Challenges in a DevSecOps Cloud Native Transformation
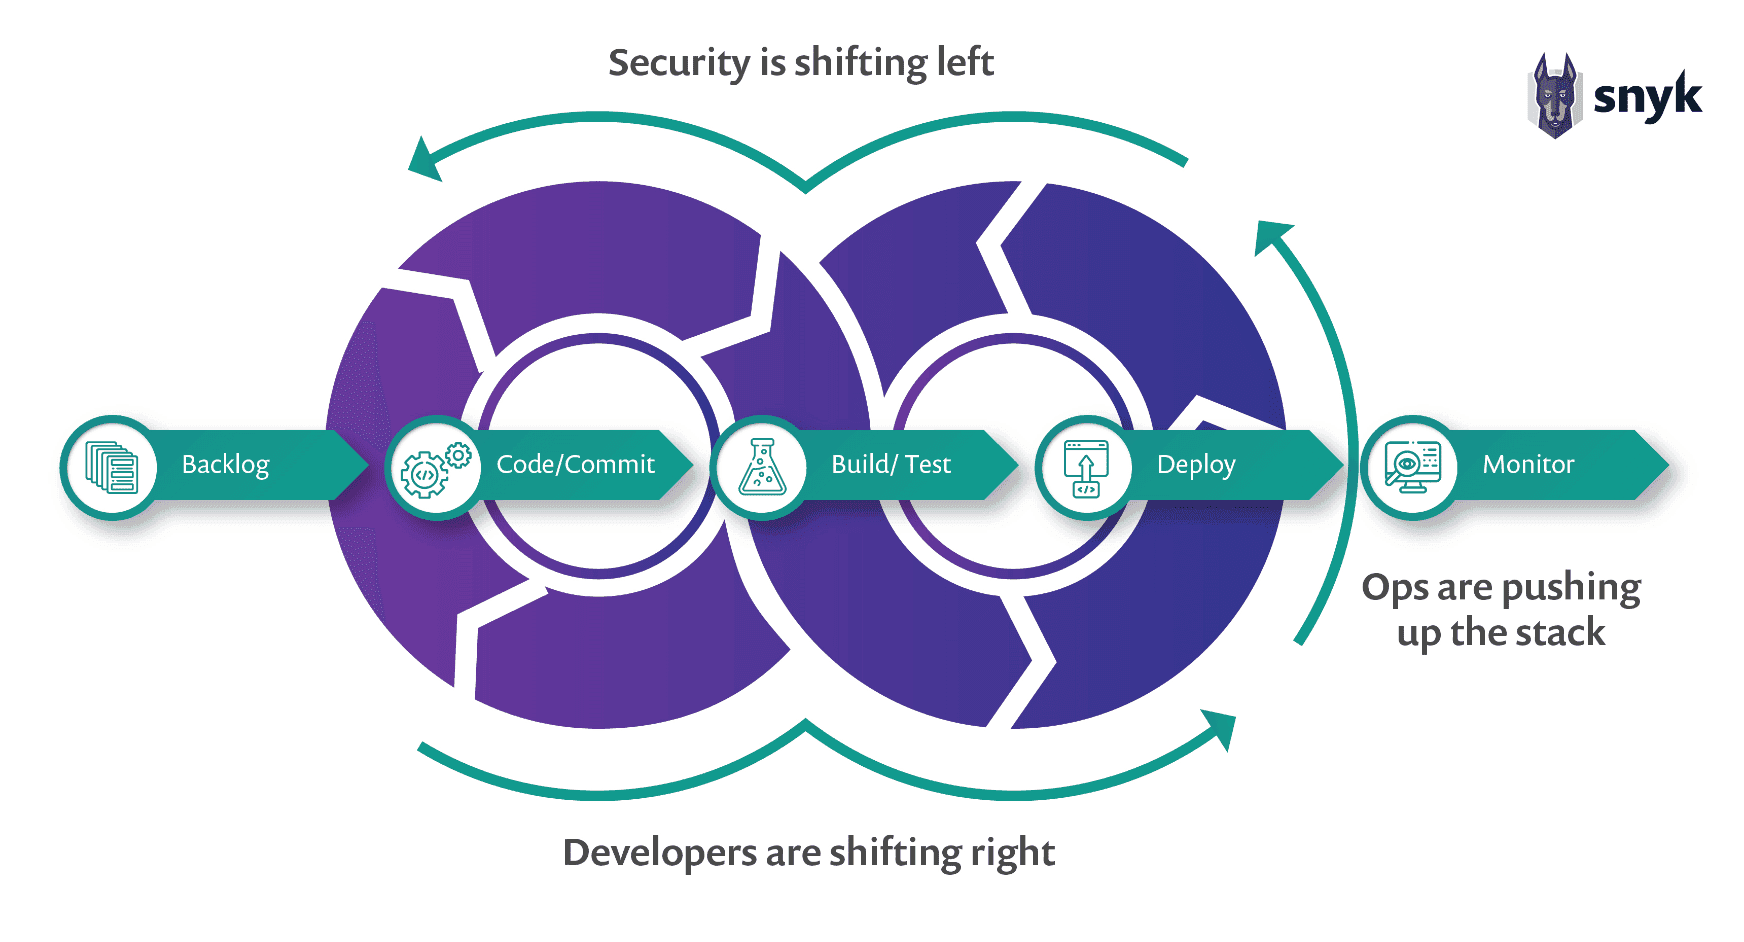
Discussion of cloud transformation is becoming almost ubiquitous across all corporate land- scapes. For just about any organization, you can rest assured they were either born in the cloud, in the middle of a cloud transformation, or at least considering a transformation to the cloud. DevSecOps software delivery often goes hand in hand with these transformations. But both that delivery model and the cloud native technologies leveraged add complexity to measuring our security posture.
DevSecOps Demands Better Metrics
As organizations move to a DevSecOps culture, predicated on efficiency and speed, it can be difficult to draw objective measurements of its impact on security posture. Traditional point-in-time metrics employed by security programs of the past, suddenly can’t keep up with the pace of the pipeline. Especially as things move into a CI/CD paradigm, security metrics can’t be static measurements but rather they require real-time visualization.
In traditional models, metrics like the number of open vulnerabilities in production deployments had very specific context and interpretation. However, in a CI/CD deployment model, we accept and expect that a certain level of vulnerability will be introduced to production through various deployments. The meaningful metric shifts from numbers of open vulnerabilities to the effectiveness and efficiency with which those vulnerabilities are remediated by subsequent deployments. Of course that’s just one example.
As things move into a CI/CD paradigm, security metrics can’t be static measurements but rather they require real-time visualization.
Cloud Native Application Security
The increased use of cloud native technologies as part of our DevSecOps software delivery has created a hyper-dynamic ecosystem in which new niche technologies and capabilities are launched in corporate software on a fairly regular basis. New technologies in containers, data storage services, API Gateways, and other technologies continue to expand the landscape of what we call cloud native. To effectively quantify the security posture across these technologies, individual metrics no longer are viable. Instead, a comprehensive approach that correlates a variety of metrics from different sources and is flexible to accommodate new sources easily is needed.
Metrics need to be gathered from disparate systems and collated centrally for effective analysis. This analysis needs to be based on the relationship between data elements. We need to consider what the movement of one data point can tell us about the meaning behind another data point’s value. Isolated metrics with arbitrarily established KPIs will not work. Instead, performance measurement needs to focus on continuous improvement, establishing meaningful and realistic KPIs based on past performance and expected trends.
Learn more about cloud native security here.
Building a Data Inventory
A challenge for many organizations is identifying what metrics will be most meaningful in terms of measuring the security posture of the organization. For instance, total open vulnerabilities across the organization is a common data element many organizations use as a metric. However, if the organization has 250 open vulnerabilities, we don’t know if that represents a good or a bad trend. If they have only a handful of applications and 50% of those vulnerabilities are high severity, there is much more concern than if they have 100 applications and only 10% of the vulnerabilities are high severity.
Now, this doesn’t mean that the total number of vulnerabilities is a bad metric, rather it’s simply an incomplete metric. We need to analyze that data element and understand the other data elements that have a causal relationship with it. In this way we can build a better overall metric that pulls context from a number of key data points ensuring that more meaningful analysis can be conducted, enabling better-informed business decisions.
Why Top Down Design Doesn’t Work
Certainly, there are a lot of different data elements that an organization may find they want to add to their metrics model. However, the goal here is to keep things simple and not let them become overwhelming. If we start at the top of our model with the final metrics that we want to measure and then work down, we’ll run into a few issues.
First, is the paralysis by analysis situation where we become so focused on finding and linking all the possible data elements that can impact that metric together that we lose sight of what we’re trying to accomplish. The process becomes overwhelming and time-consuming and the result will likely be something that can’t really be implemented anyway.
Second, as we dig down into those data elements we’ll typically find that the organization simply doesn’t have the capability for measuring some of those elements, and thus we’ve now added a hard decision point. Either we create tasks to modify or implement systems to measure those data elements or we have to remove those data elements from our model. If we do that on a large scale, it again becomes onerous and threatens the roll-out of our metrics model.
A Bottom Up Approach
To ensure a smooth and easy initial adoption, orgs need to begin by looking at the data elements that are available and cataloging those to start with. Begin by just inventorying the tools and processes that interact with your software pipeline. Security practices such as Threat Modeling,
Think about data that may come out of processes that are connected to your delivery pipeline.
Software Composition Analysis (SCA), Static Application Security Testing (SAST), etc. But think beyond just specific security tooling, where else in the pipeline can you find data elements that might provide context for understanding your security posture?
For instance, think about your bug tracking systems. Measuring the time that it takes to resolve issues that are logged can provide context if your cloud native security vulnerabilities are logged as bugs. Backlog management, understanding the volume of user stories coming in, can also shed light on how well an org is managing its security response. Consider your code repositories. As we’ll see demonstrated later, the number of issues, commits, and potentially pull requests in a given repo can provide additional clues as to our overall security posture.
Don’t get trapped into only thinking about tooling either. Think about data that may come out of processes that are connected to your delivery pipeline. For instance, how does risk management of the organization get involved? Are there data elements produced by those processes that could feed context into our measurement of security posture? Specifically think in terms of risk acceptance/exceptions processes that can help draw better context for existing technical debt.
Consider your organization’s compliance or privacy programs, and identify which processes in them feed into or consume data from the pipeline. Understanding the relationship between vulnerabilities identified in our software and the privacy or compliance requirements they potentially violate can create additional context. Changes in governing standards can help us better understand why vulnerabilities of a certain type have been fixed more often or are being discovered more regularly. All of this is important for drawing a complete picture of the performance our organization has achieved in addressing its security posture.
Compile Your Existing Elements Inventory
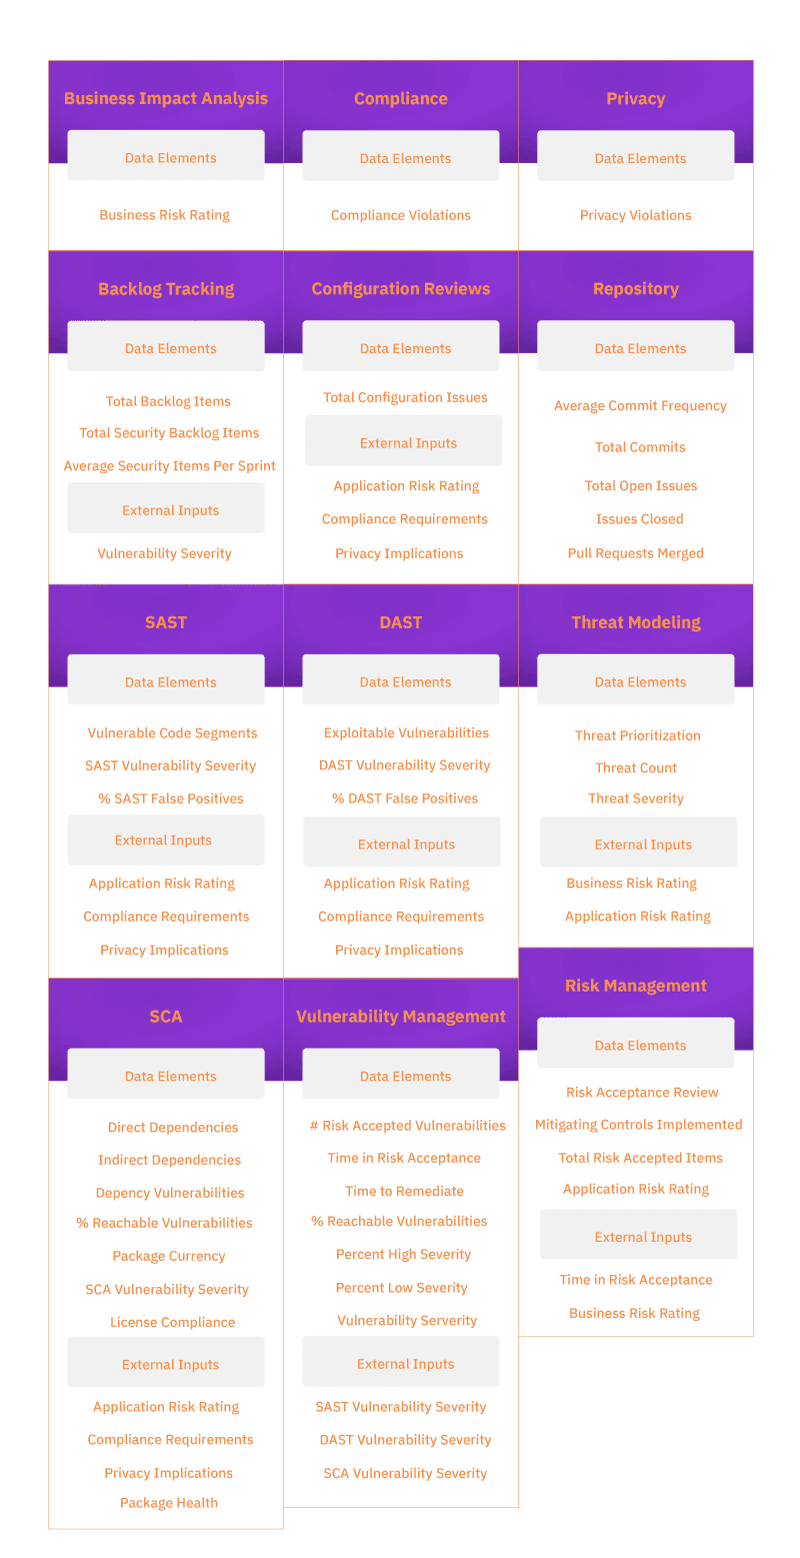
To make this new metrics approach easy to adopt, we want to inventory the existing data elements that we already have available to us. Begin by first listing the various systems and processes you’ve identified that may have data we can leverage. Then, list the specific data elements that are being produced or can be easily extracted from those systems and processes.
For some organizations this may be a considerable amount of data, for others, there may not be many data elements you can identify. However, neither should be a deterrent. The goal here isn’t to have the most far-reaching set of data metrics possible, it’s to look at the data you have and be able to make some meaningful measurements about your organization’s security posture. Additionally, measuring security posture is less about attaining some arbitrary number or rating and more about being able to demonstrate that your organization is improving over time.
What you should end up with is an inventory of all the systems and processes that could potentially be leveraged to build a metrics model along with the specific data elements that are available to your organization from those systems and processes. When complete, you might begin to notice that there are some data elements that are duplicated across multiple tools or programs. An example is provided in Figure 0.2 in the next section.
Eliminating Duplicates
To eliminate duplicates, we need to consider which is ultimately the system of record. Often you’ll find that a particular data element which appears under multiple systems is actually only produced by one, but is used as an input to the others. These are relationships we want to capture. So the next step is to analyze your duplicates, determine where the data element originates and for the others determine if that data element might actually be an input rather than some- thing created within that process or system.
For example, if your inventory of systems includes a vulnerability management tool, a SAST tool and a DAST tool, you may have identified “Vulnerability Severity” as a data element in all three of those. But where does that severity originate? The reality is that data originates in the SAST and DAST tools and it is an input for the Vulnerability Management tool.
At this point, we still have multiple systems producing the same data element. So now we need to consider how each element is defined so that we can refine those definitions to ensure the two data elements are distinguished from each other. It could be as simple as defining one as SAST Vulnerability Severity and the other as DAST Vulnerability Severity. The key here is that we have the granularity to understand the differences between the sources of the data.
Prepared for the Future
The point of all this effort thus far has been to identify what data elements we have currently and define them in a sufficiently granular manner. This sets up our model to be more dynamic such that we can easily plug in new technologies as they become a part of our environment. In a cloud native world, where the technologies at play are very dynamic, having the ability to easily add new data elements to our overall security metrics model without having to refactor the entire model is crucial.
As you’ll see in the next section, building the metrics model now becomes an exercise of mapping relationships and influences between data elements. That work is already started in your inventory and now we’ll take the next steps to turn it into a full model that results in a few key objective metrics on which we can base our KPIs.
Amado por desenvolvedores, confiável por segurança
As ferramentas da Snyk com foco nos desenvolvedores oferecem segurança integrada e automatizada que atende aos seus requisitos de governança e conformidade.
Connecting Data Elements for Meaningful Metrics
Taking the data elements we’ve identified and turning those into a functioning group of meaningful metrics is what really makes this model of security measurement different from most discussions of security metrics. This model avoids the typical focus on individual numerical measures and instead places emphasis on understanding the causal relationships between those measurements in order to build greater context and therefore more meaningful metrics.
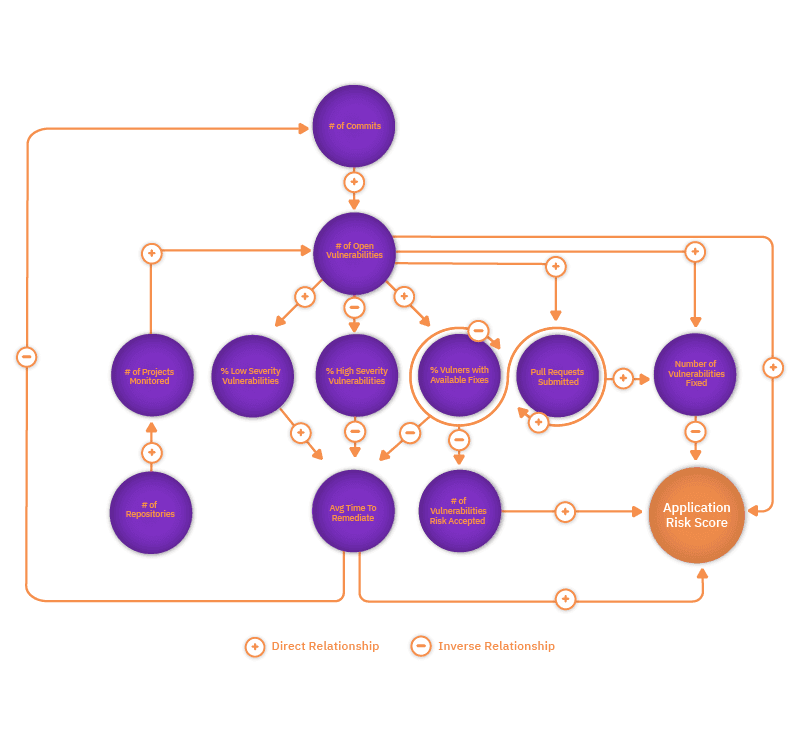
To document the causal relationships between our data elements and to correlate them into an overall metric, we leverage causal loop diagramming. Causal loop diagrams (CLDs) are a perfect solution for describing and visualizing complex relationships between disparate data points. For purposes of our metrics model, we’re going to leverage four primary elements of a causal loop diagram:
Nodes – Individual data points (or what’s been described here as data elements)
Links – The connections between variables
Link Type – Either positive of negative denoting direct or inverse relationships
Loop Labels – Either balancing or reinforcing
A few characteristics of causal loop diagrams make them the perfect choice for this use case. First, causal loop diagrams move away from linear cause and effect to instead allow us to visualize the continuous and dynamic nature of what we’re trying to represent. In this case we’re talking about security metrics and need to represent how changes in the data elements over time will impact each other. Second, causal loop diagrams are meant to never be finished. They lend themselves to easily adding additional nodes and loops which is perfect considering our need to accommodate new data elements from new cloud native technologies over time.
Getting Started with Your Causal Loop Diagram
Looking at guides on the web you’ll find there are a lot of different strategies for how to create a CLD. However, once again in the interests of trying to keep the process simple, a more iterative approach works best and is consistent with the overall paradigm. To that end, from your inventory, you can take any two data elements that have a causal relationship between them and just start there.
For instance, if you have a number of commits and vulnerabilities detected listed, those two elements have a causal relationship. As the number of commits go up, probability and statistically we can expect that the number of vulnerabilities found will go up. In our diagram then, we’d add the number of commits and vulnerabilities detected as nodes with an arrow link from the former to the latter. Further, since as commits go up, vulnerabilities go up, we would add a plus sign next to the arrow to denote the direct relationship between them.
That is a linear relationship so far, however, with a CLD we’re ultimately looking to create loops. So analyzing this situation, what if any effect would trigger the reduction in the number of vulnerabilities on the number of commits? Well, considering there would be fewer security bugs on the backlog it’s likely that the number of commits would ultimately be reduced. So we can add this arrow and denote it with a positive as well since again it is a direct relationship.
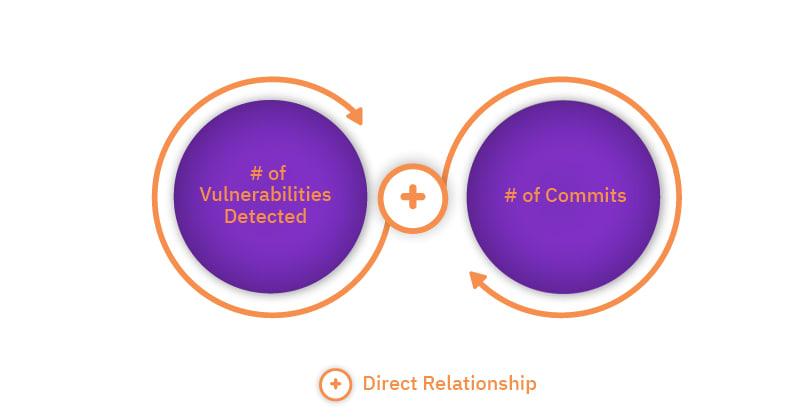
A loop like this is called a reinforcing loop. As one data element increases the other will increase. So we would label the loop with an R to denote this. So this seems alarming, it suggests that there will be exponential growth of vulnerabilities and commits across my application that will run unchecked. While that may feel like it is our experience sometimes, the reality is a two-node loop is rarely complete and valuable for analysis.
Visualizing the Model
Some processes for creating CLDs suggest telling the story as a way to analyze the system being described and identify additional nodes and relationships. Indeed, that’s a great way to build upon the loop we’ve created here. We know that in reality there is more to this story and our commits and vulnerabilities don’t become a never-ending exponentially growing dilemma.
So what else impacts the story here? Perhaps the severity of the vulnerabilities identified has some impact on the number of resulting commits? In our research at Snyk, we looked at the aggregated data from security scans per- formed in 2020 and found that as the total number of vulnerabilities identified went up, the average severity score of the vulnerabilities identified actually decreased. So that’s another relationship we want to capture, but more importantly, how does that influence the number of commits? If by policy in your organization, high-severity vulnerabilities have to be fixed much faster than low severity vulnerabilities, it stands to reason that lower severity vulnerabilities may be batched up into groups of fixes or fixed alongside other user stories where high severity vulnerabilities might need immediate fixes and their own dedicated commit cycle. So we can add these elements to our CLDs with the appropriate relationship indicators.
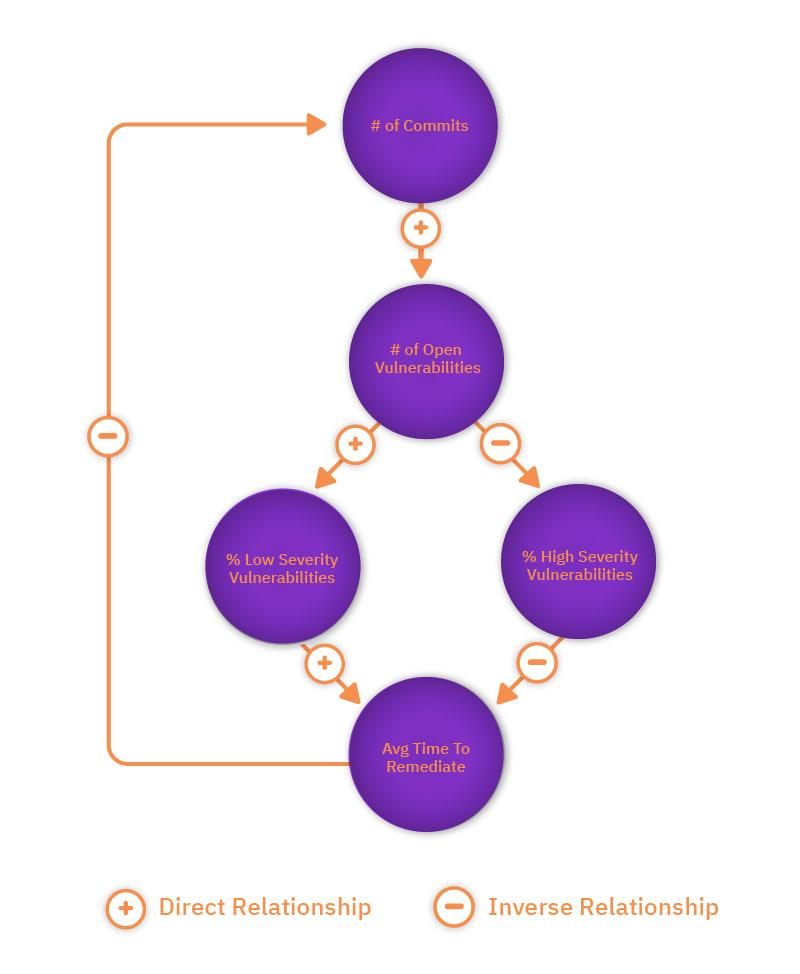
Iteration to a Final Meaningful Model
So the rest of the diagram becomes an exercise of iterations. As stated earlier, a CLD is never really finished as there are always further aspects that can be analyzed deeper and more causal relationships added. But this is why it is important for this exercise to limit yourself to those data points that you actually have available to you. Otherwise, we could dive down hundreds of rabbit holes and never get to a meaningful model for our metrics.
Examining the stories behind how data elements are related may identify additional data elements that are not currently available. Perhaps they’re not being measured, or a process doesn’t exist to capture them. Document these for later, these will become part of a longer-term improvement plan for your metrics model. Ensure that the relationship they impact is represented in a generalized fashion using only the elements you have for now and potentially add a footnote or annotation to describe where a new element might be helpful.
Knowing When to Quit
This is, of course, an iterative process that could continue on without end. If a CLD is never finished, how do we know when we’ve reached a point where we should stop? There are a few answers to this question. The first is if you run out of data elements on your inventory, obviously you’re done. Unless you can identify additional data elements you have available that would fit in your drawing, you can go no further.
Second, if you reach the point where none of the remaining data elements on your list have a causal relationship to any of the existing nodes on your drawing. This will happen often when certain data elements simply are not a part of the story. It does not however mean that they are unimportant or should be discarded. You may choose to expand the scope of your CLD or you may choose to create a different CLD that focuses on a different story altogether.
Selecting Key Indicators
At this point, there is still no definition of metrics and KPIs. This is an intentional aspect of this approach that ensures not only will our KPIs be truly measurable but that they’ll be meaningful to the organization. Defining KPIs and then working backward into metrics and data elements that compose them too commonly sets organization on a road to chasing after data rather than measuring results. We want something immediately applicable, a model for our metrics that can be implemented immediately and grow as the dynamics of our environment grows. In short, this type of metrics model is targeted to driving continuous improvement.
To translate the CLD into a KPI or multiple KPIs, begin by looking at the nodes. Do you see any nodes that have only incoming causal relationships but no or maybe only one outgoing causation? This is a strong indicator that what you’ve found is a top-level data element. For instance, application risk might be one of your nodes. But application risk doesn’t impact the quantified data elements; it’s a correlation of the various data relationships. Therefore, that can be a meaningful metric, if we can successfully quantify it. More on that in the next section. If you don’t have any such nodes, consider how you could define a node that would summarize the CLD you’ve drawn. What is the theme in the story you mapped to which the various loops of your diagram could feed important characteristics? Look to define that one additional node that would be impacted and therefore have incoming relationships from the loops in your diagram. Add that node, insert those relationships, and that becomes your metric.
Defining KPIs and then working backward into metrics and data elements that compose them too commonly sets organization on a road to chasing after data rather than measuring results. We want something immediately applicable, a model for our metrics that can be implemented immediately and grow as the dynamics of our environment grows. In short, this type of metrics model is targeted to driving continuous improvement.
Of course, you may find that you have multiples of these, in fact, you likely want to define multiple metrics. Continue to analyze the loops in your diagrams, looking for those nodes that have a high number of incoming influences but very few outgoing feedbacks. These are your best candidates.
Quantifying and Measuring Cloud Native Security Metrics
This is what it all comes down to in the end. We’ve built a complex CLD with lots of data points and shown how they relate, but now how do we express this complex CLD in terms of the high-level metrics that we want to use for our KPIs?
In the ever-increasing complexity of our cloud native environments, the KPIs we choose need to tell the story of our application security posture. The goal is to build a scoring model for each of the metrics identified. Ultimately what we want is a normal (bell curve) distribution.
The easiest way to lay it out is to start with the top-level metric and decide what scale you’ll use. For the purpose of this discussion, we’ll use a simple 1-9 scale. Assign the median range to that top-level metric (in this case 5). Now work backward. To the sub-metrics and down to the individual data elements. Each node should be assigned a scoring model that uses the same scale. Based on the Link Type, you can now define how each data element’s score modifies the upstream scores that it has a direct causal relationship to.
This is where organizational intelligence will take over. Weighting can be applied to the metrics if you choose. For instance, consider a top-level metric of Application Risk which has four causal metrics of Time to Remediate, Percentage of High Severity Open Vulnerabilities, Number of Risk Accepted Vulnerabilities, and Percentage of Low Severity Vulnerabilities. The first three are direct relationships while the last is an inverse relationship. The percentage of High Severity vulnerabilities would likely influence the overall application risk more than the number of risk-accepted items would. Therefore, appropriate weighting should be included in the calculations.
Continuous Improvement
With a complete scoring model defined, it’s easy to believe you’re done. But the reality of metrics is we are never done and there is always room to improve or expand the intelligence of our metrics gathering. With cloud-native transformations, the locations of data, the types of data available, and so forth will continue to change. As the complexity of our environments grows, the model must continue to evolve and be refined as well.
This model allows for the addition of new data elements with relative ease and without impacting the validity of previous models. It provides the flexibility to start small with relatively few data elements and continue to build a more detailed metrics model.
By defining a scoring model that quantifies the metrics identified in our CLDs we can objectively measure our security posture and demonstrate improvements while simultaneously allowing for improved metrics refinement. With any security program, quantifying our measurements, and focusing on continuous improvement while also improving the program itself is the key to success in the long term.
Amado por desenvolvedores, confiável por segurança
As ferramentas da Snyk com foco nos desenvolvedores oferecem segurança integrada e automatizada que atende aos seus requisitos de governança e conformidade.
Key Takeaways
As you can see, while cloud native technologies have brought us new complexities in terms of understanding cloud native application security posture, a new way of looking at metrics can give us more meaningful measures. Throughout this paper there are some key takeaways that should help guide you as you develop a metrics strategy for measuring your cloud native application security posture:
Focus on the relationships between data points rather than isolated measures
A foundational element of building truly meaningful metrics is understanding that the value of one data point can have different meanings depending on other related data points. Using causal loop diagrams helps us visualize these relationships.Create a model that leverages what’s available but easily accommodates new data points
Any metrics model needs to be based on the data that is presently available. However, as new cloud native technologies are introduced to our environments, we need to easily introduce new data points. This approach provides the flexibility to accommodate new data elements to further refine our metrics.Metrics are about continuous improvement not the attainment of arbitrary standards
Measuring a security program needs to be focused on the improvements being made, not achieving some arbitrary level of perceived security. Our goals should drive efforts that address improving deficient areas in our program and demonstrating that improvement over time.Quantification of security metrics must be tailored to the organization
Every organization is different in the terms of their risk appetite, environmental makeup, and overall approach to their security programs. Metrics are only meaningful when organizational intelligence is leveraged in the definition of quantitative measurements.
Ready to get started with securing your cloud native applications? Learn more about Snyk’s cloud native application security platform.
Up Next
Cloud native security guide for building secure applications
Cloud native Security is the practice of securing cloud-based platforms, infrastructure and applications by building in security throughout the development process
Continuar lendo


