How to send Snyk vulnerability data to the New Relic observability platform
Harry Kimpel
21 de outubro de 2022
0 minutos de leituraSecurity and observability data go hand in hand when it comes to application health. If you can put those two sources of data behind a single pane of glass you can make your life a lot easier. By leveraging the different options that the Snyk platform provides, you can send all your application security vulnerabilities found by Snyk directly to your New Relic observability platform. Let’s see how!
Prerequisites
Here are all the necessary links to get started:
Vulnerability scanning with Snyk
Snyk’s capabilities include static application security testing (SAST) of proprietary code, software composition analysis (SCA) of open source dependencies, container scanning, and cloud infrastructure scanning.
Ideally, the scan results can be used wherever and whenever it is most appropriate for the given use case. CLI and IDE integrations can of course show scan results directly in the terminal or directly within the IDE (red squiggly or wavy lines in your code editor). You can also visualize the data in the portal/UI from repository scans or from scans inside your favorite CI/CD environment.
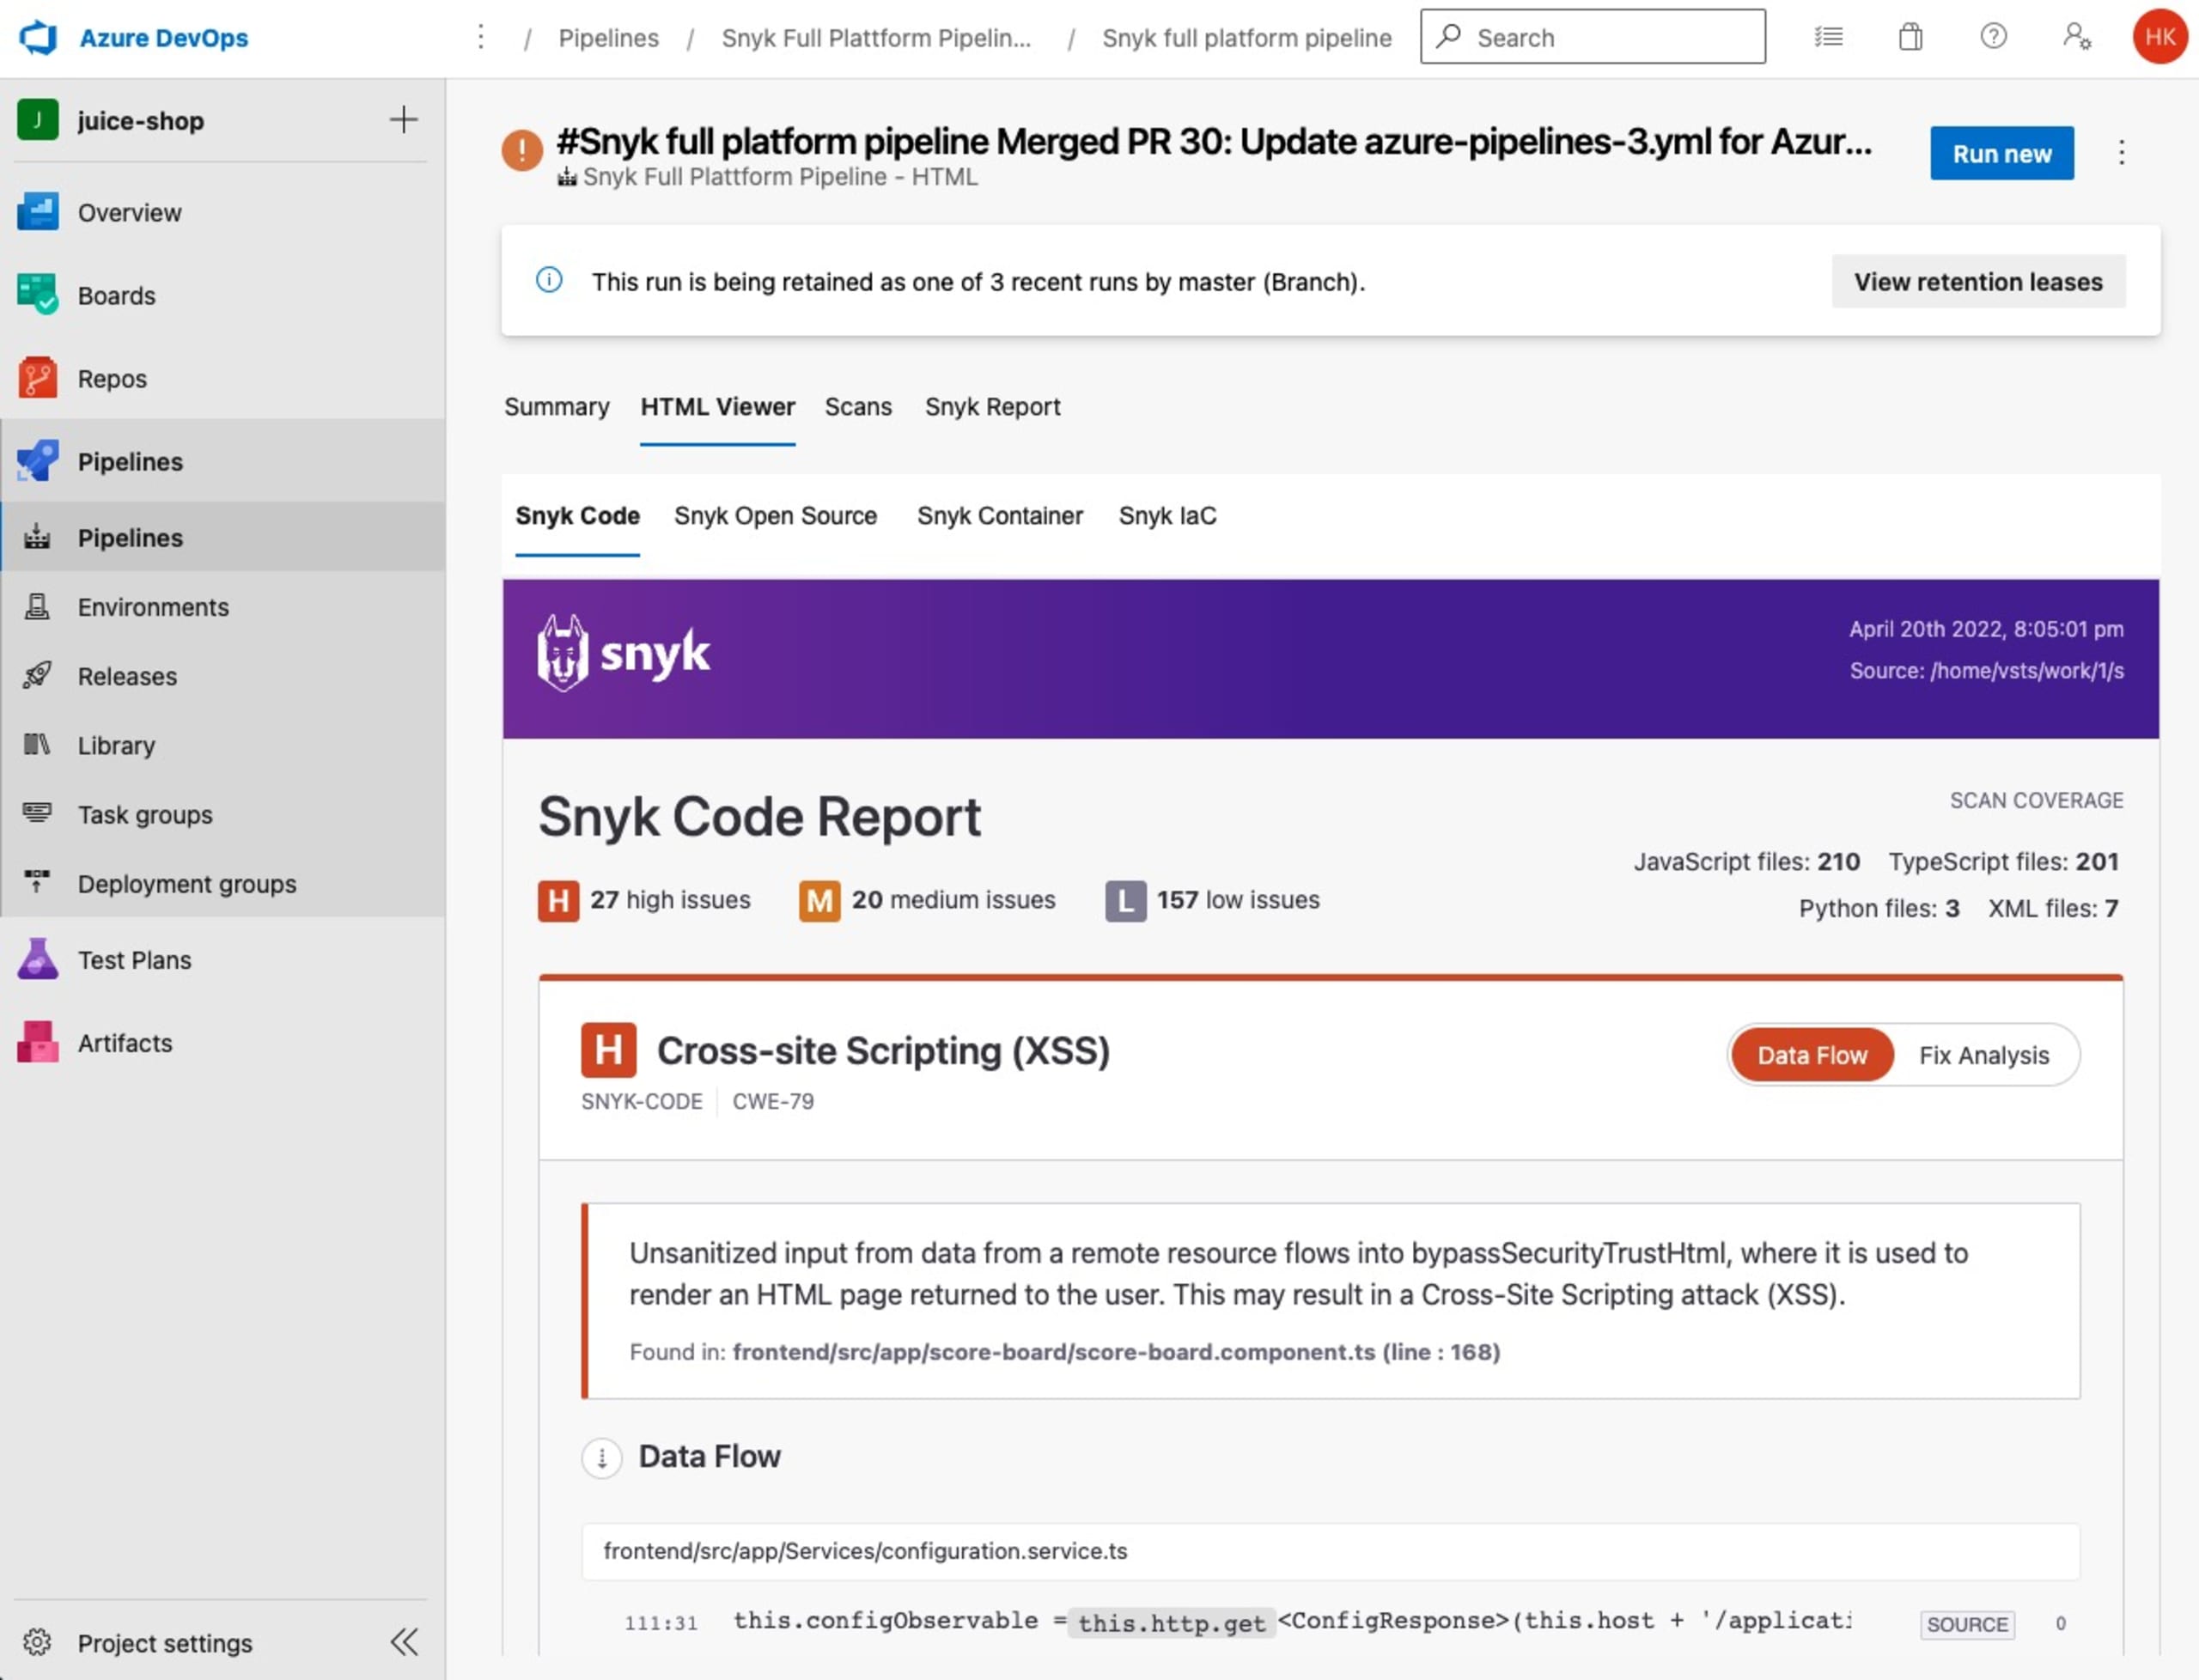
What’s also very nice is that you can also leverage native solutions for the various CI/CD tools. For example, you can send scan results into GitHub or GitLab Security Center, or show results in Azure DevOps reports or various other forms of integration.
The importance of observability
New Relic is a great tool in the observability space that allows you to integrate and correlate different kinds of monitoring data such as metrics, events, logs, and traces (MELT) into a single platform with native capabilities for a broad set of environments.
With New Relic, customers know exactly what is going on with their applications through APM or by monitoring their Kubernetes clusters to know what Pods run including the health of all its containers. In such a use case, you ideally would also want to understand whether or not some of these deployments have any security issues or contain potential security vulnerabilities.
This is the type of use case that is covered in this article.
Integrating Snyk with New Relic
First of all, you should reflect on your use case and your target environment, and then decide upon the type of integration that is best suited to your requirements.
These are the options:
New Relic Security API using Snyk webhooks
New Relic Events API using Snyk webhooks
New Relic Metrics API using Snyk exporter
For example, if your entire architecture and landscape runs on Kubernetes, leveraging Prometheus metrics, then the Metrics API would be a good fit. However, if Kubernetes only covers parts of your technology landscape and you have other environments that you also want to cover, then maybe webhooks are the way to go.
Note: Integrations 1 and 2 are based on Azure Functions written in C#. The purpose of these is just to provide sample quickstarts and give you an idea of the process and formatting of the payload. You can of course also adapt these to other programming languages and runtime environments (serverless, such as AWS Lambda, or any other suitable environment) of your choice.
Option 1: New Relic Security API using Snyk webhooks
This is the newest approach for sending any type of security-related information into the New Relic platform. The benefit of using this approach is that New Relic “understands” the type of data being ingested and is then able to provide a curated user interface on the information and also offers a standardized way of correlating this information with other types of data that New Relic is able to consume.
Examples of such correlations are:
An application that is being monitored using APM, the repository where this application resides in, and correlated issues Snyk identified from an application security perspective
A container that is running inside of a Kubernetes cluster where New Relic knows everything about the runtime behavior and detailed information about the security aspects of the container from Snyk
Create an Azure Functions app
First, follow the regular process to create and configure an Azure Function app (please refer to these Microsoft docs to learn more). An example code for the actual Azure Functions code can be found in this repository.
Configure Azure Function Environment Variables
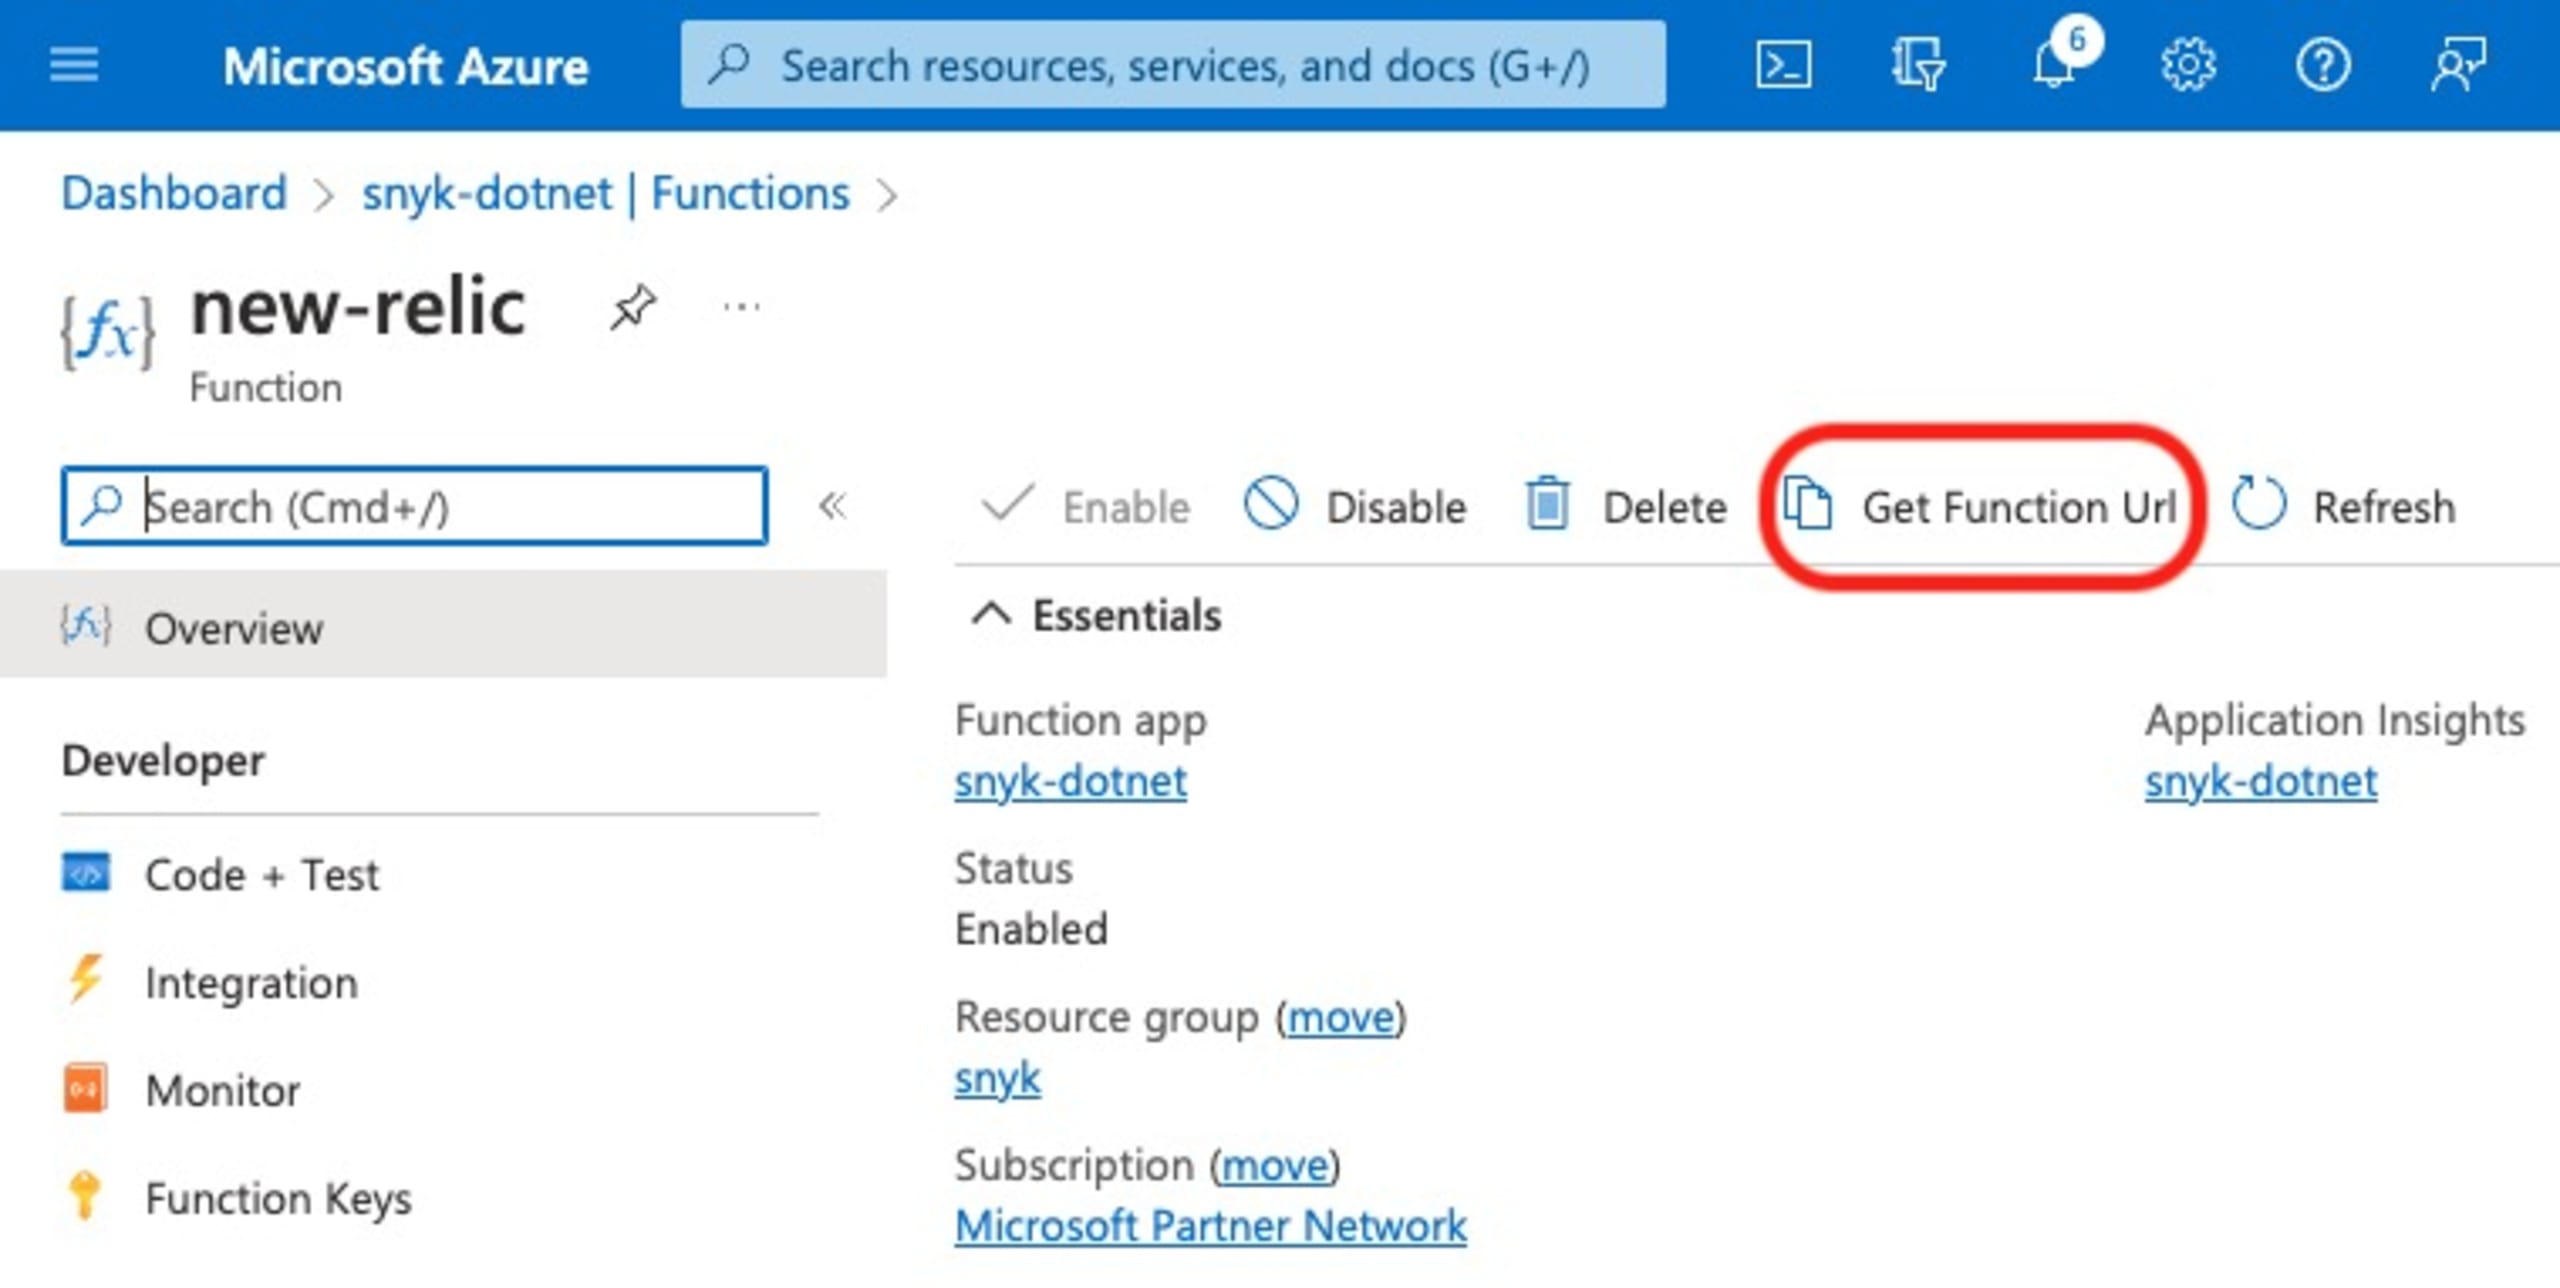
Go into your Azure Functions App Configuration (please refer to these Microsoft docs to learn more) and add the following new application settings:
NEW_RELIC_SECURITY_URL: URL for the New Relic Security API, i.e. https://security-api.newrelic.com/security/v1
NEW_RELIC_LICENSE_KEY: New Relic license key
If you are using Azure DevOps Repos with your Snyk account, you may also want to configure this application setting:
AZURE_DEVOPS_ORG: The name of your Azure DevOps organization
There are some additional optional parameters for troubleshooting in a separate New Relic event. If you want to leverage this, then also configure the next two application settings:
NEW_RELIC_INSIGHTS_URL: URL for the New Relic accounts' event API, i.e. https://insights-collector.newrelic.com/v1/accounts/{NR-ACCOUNT-ID}/events
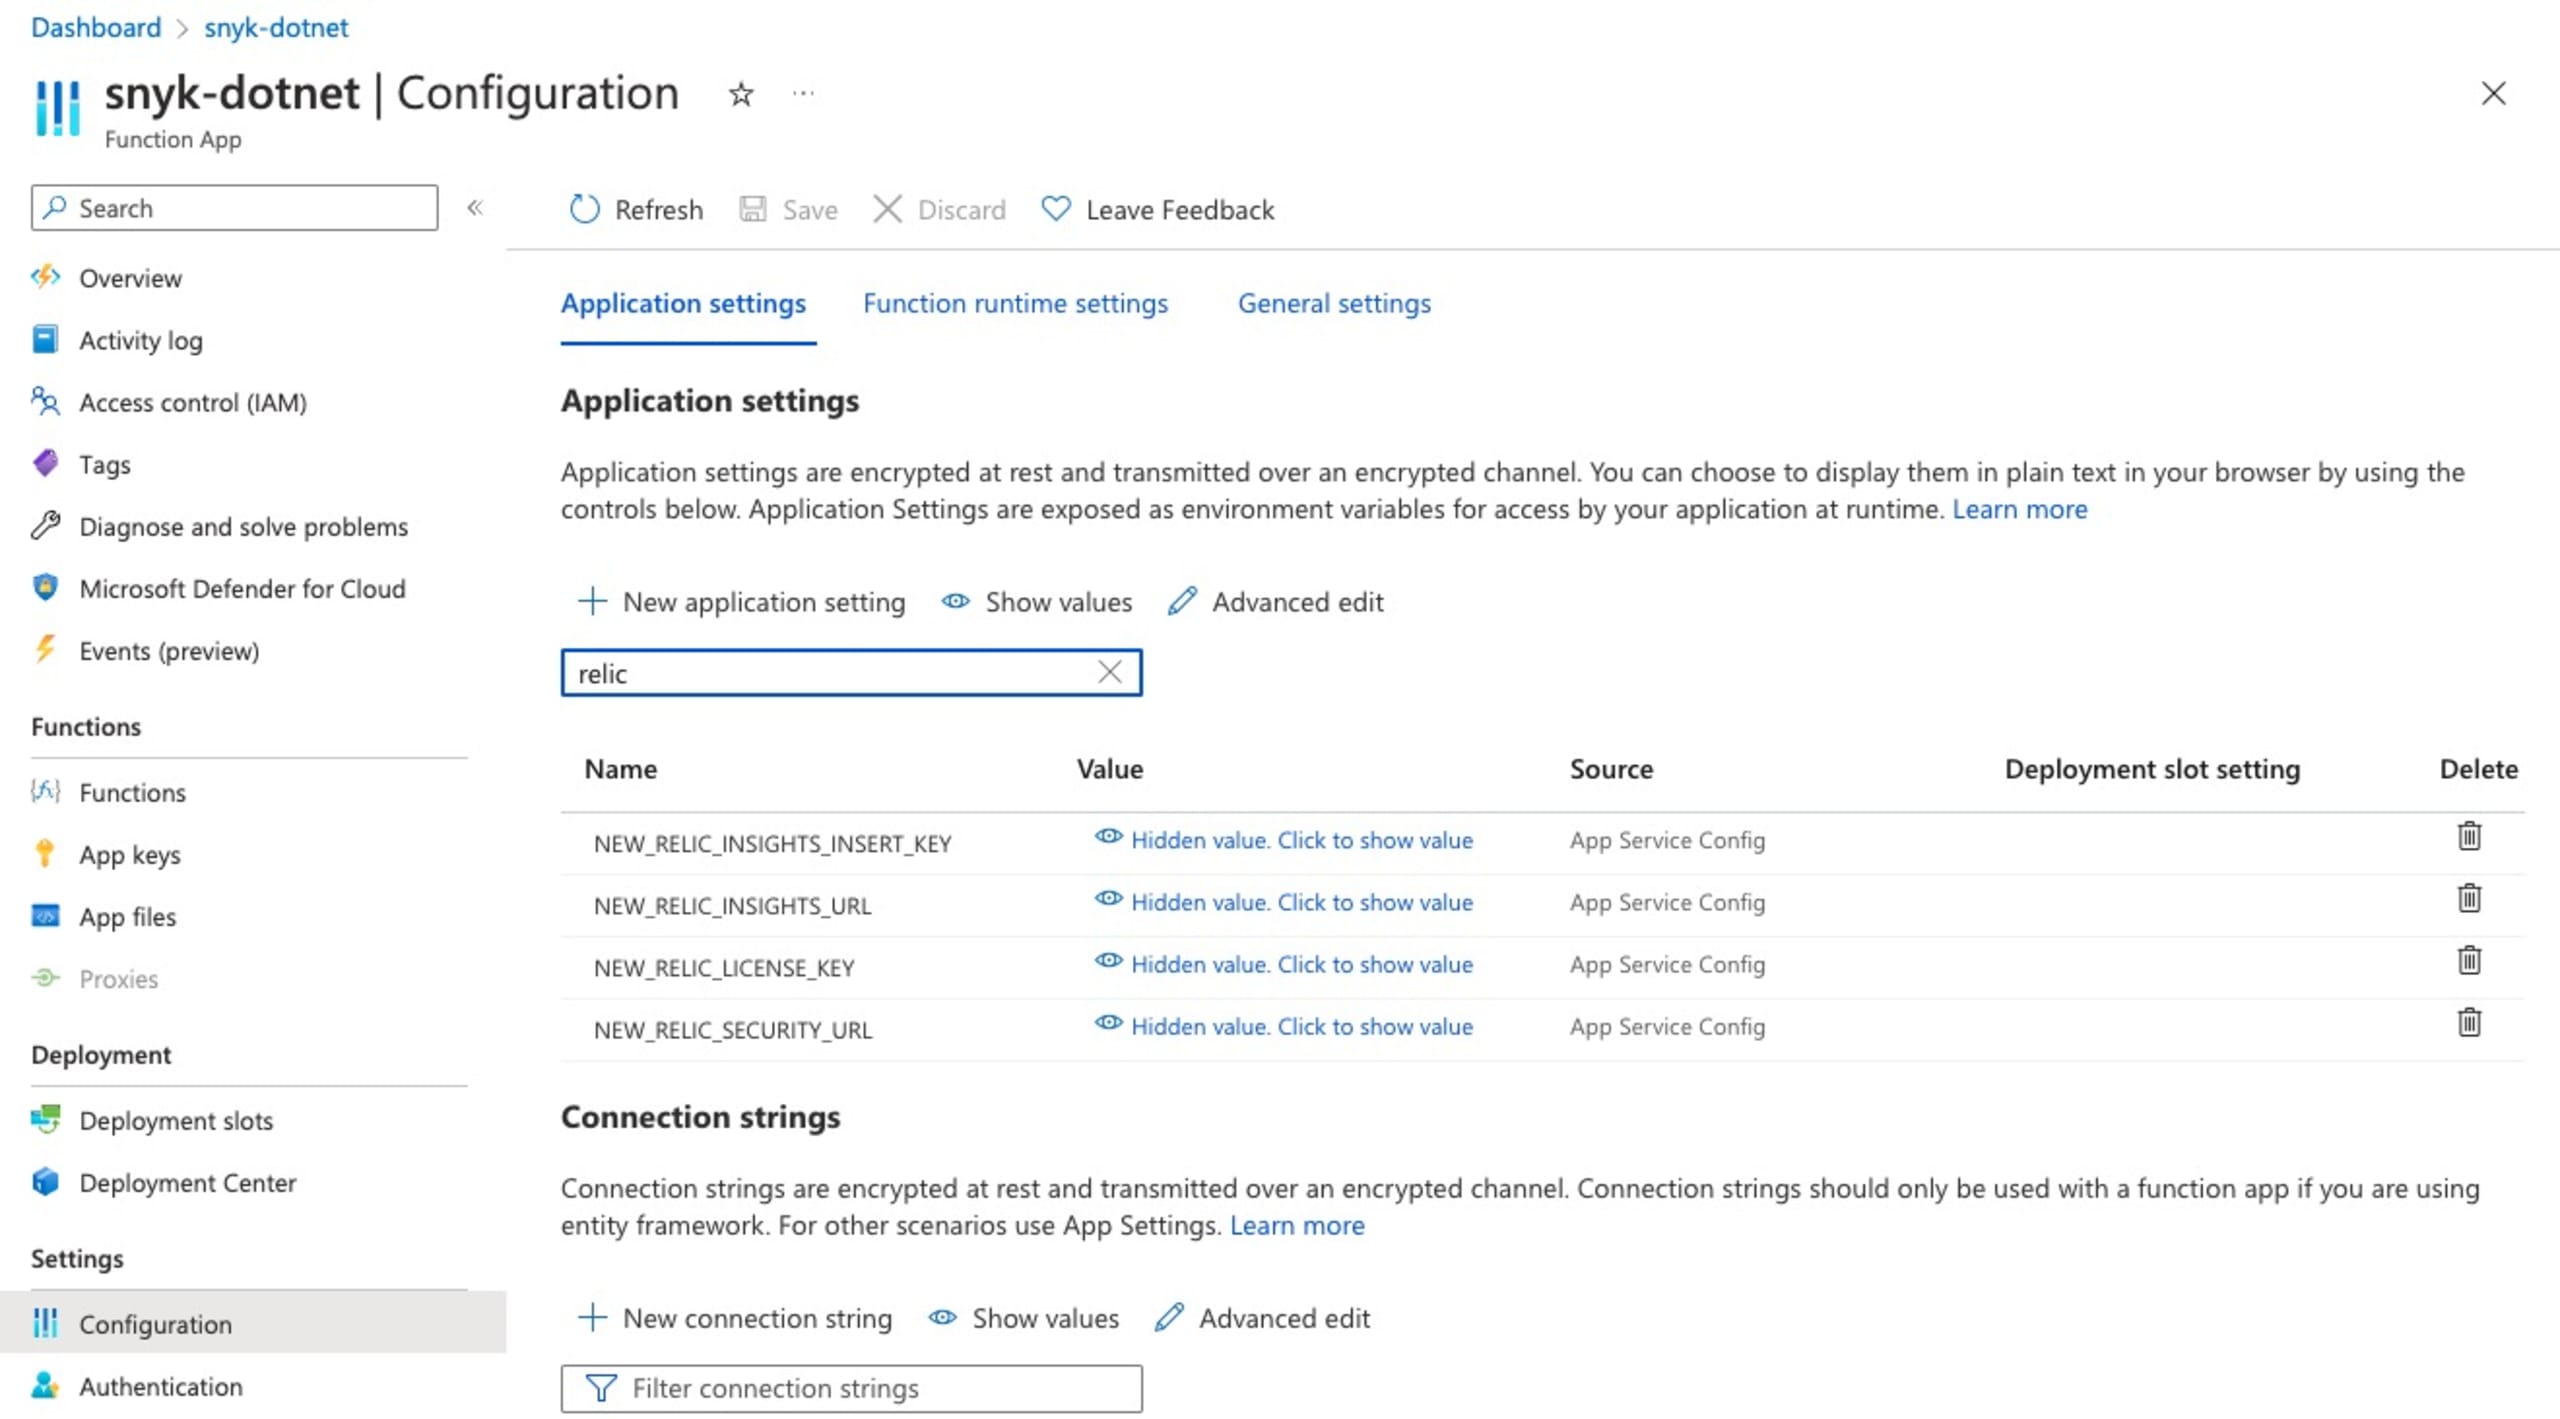
Get Azure Functions URL
Select the appropriate Azure Function and click Get Function Url. This is the URL you will need for the next step in order to create the Snyk webhook.
Create a Snyk webhook
The Snyk webhook can easily be created using the provided API. The API only requires the Snyk organization ID, the Snyk authentication token, and target webhook URL to be provided. An example request may look like this and you can use your favorite tool to actually send the request.
1POST https://snyk.io/api/v1/org/{SNYK-ORG-ID}/webhooks HTTP/2
2Host: snyk.io
3Authorization: token {SNYK-TOKEN}
4Content-Type: application/json
5
6{
7    "url": "https://{URL}",
8    "secret": "my-secret-string"
9}
As a result, you will get a response like this:
1{
2  "id": "{SNYK-WEBHOOK-ID}",
3  "url": "https://{URL}",
4}
You could then use the Snyk Ping API in order to proactively trigger the webhook in order to test your integration:
1POST https://snyk.io/api/v1/org/{SNYK-ORG-ID}/webhooks/{SNYK-WEBHOOK-ID}/ping HTTP/2
2Host: snyk.io
3Authorization: token {SNYK-TOKEN}
4Content-Type: application/json
Snyk curated UI and quickstart dashboard
Once the Azure Function and Snyk webhook are created, you should see data coming in for Snyk projects with a configured retest frequency or rather projects that you scan manually and where Snyk identifies new issues.
You should be able to look into the Vulnerability event type to validate that data flows into New Relic.
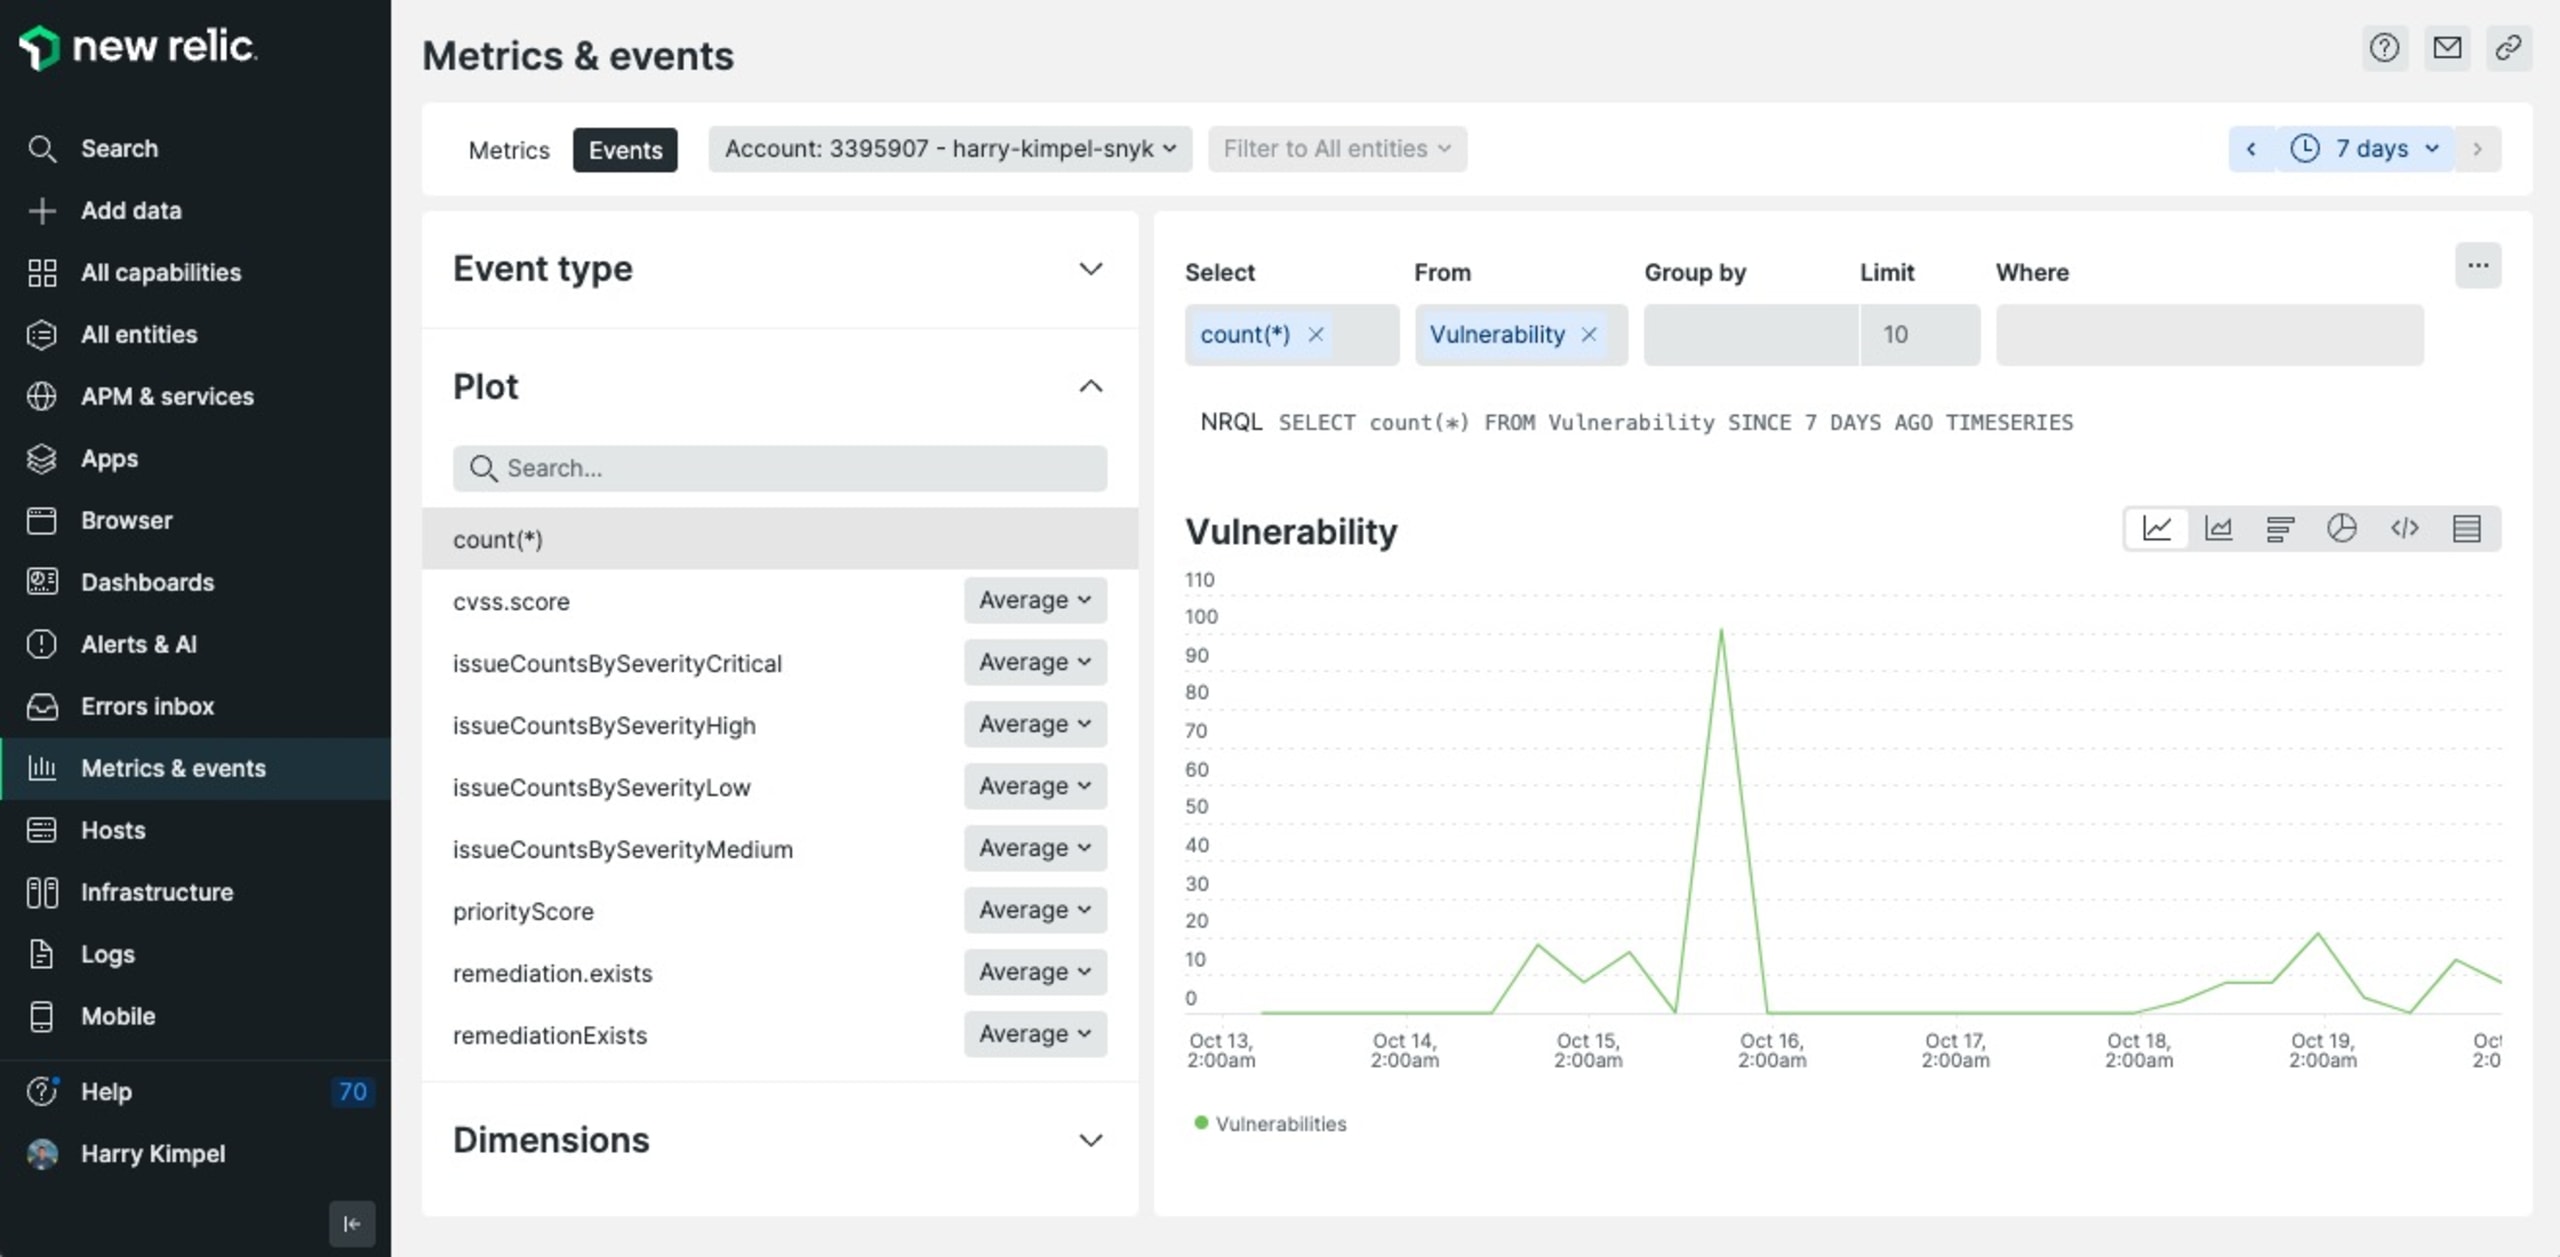
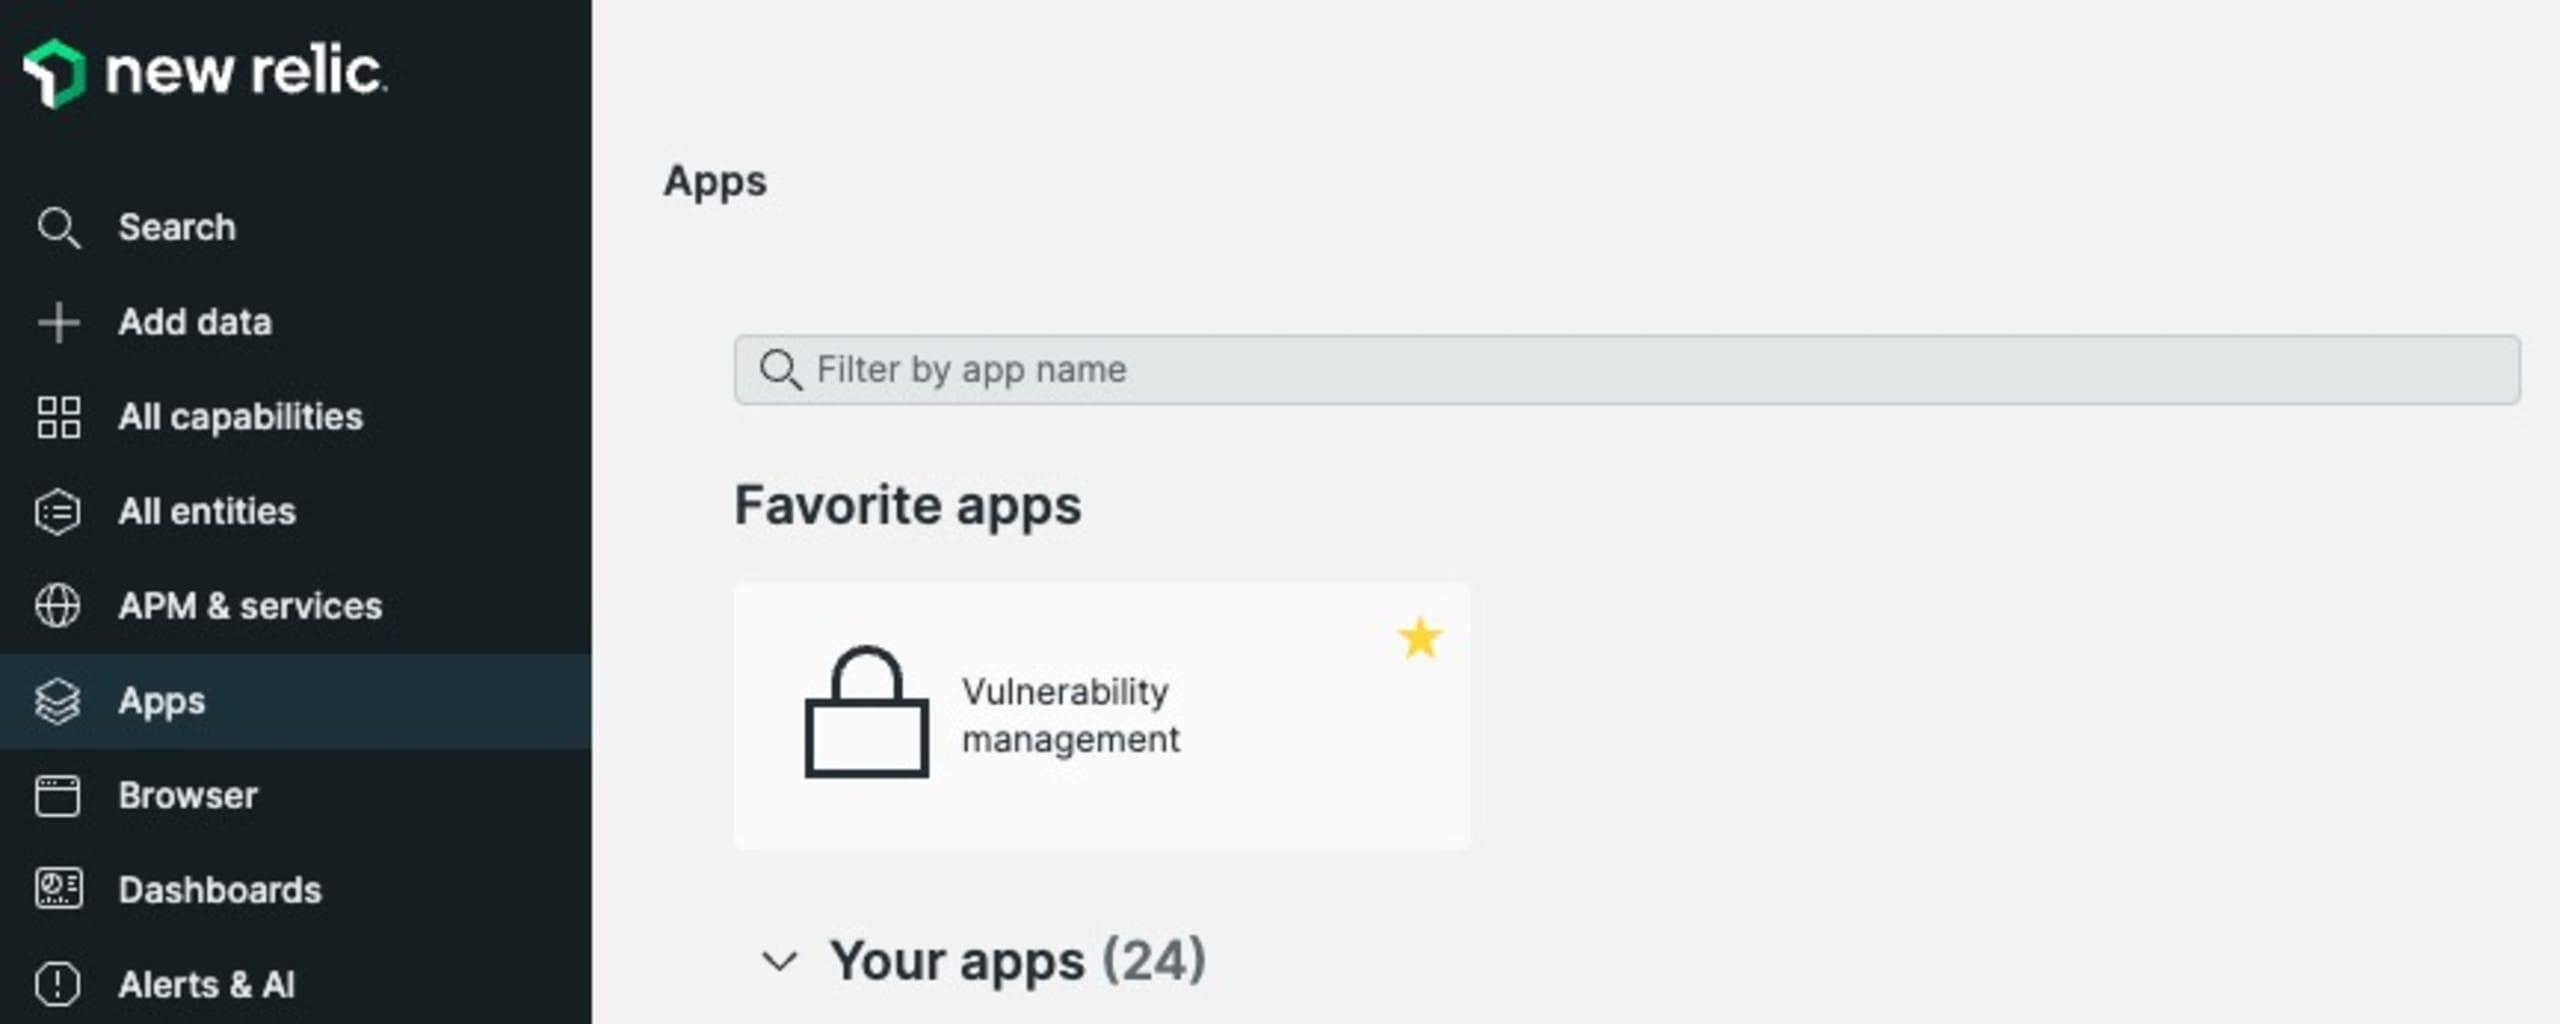
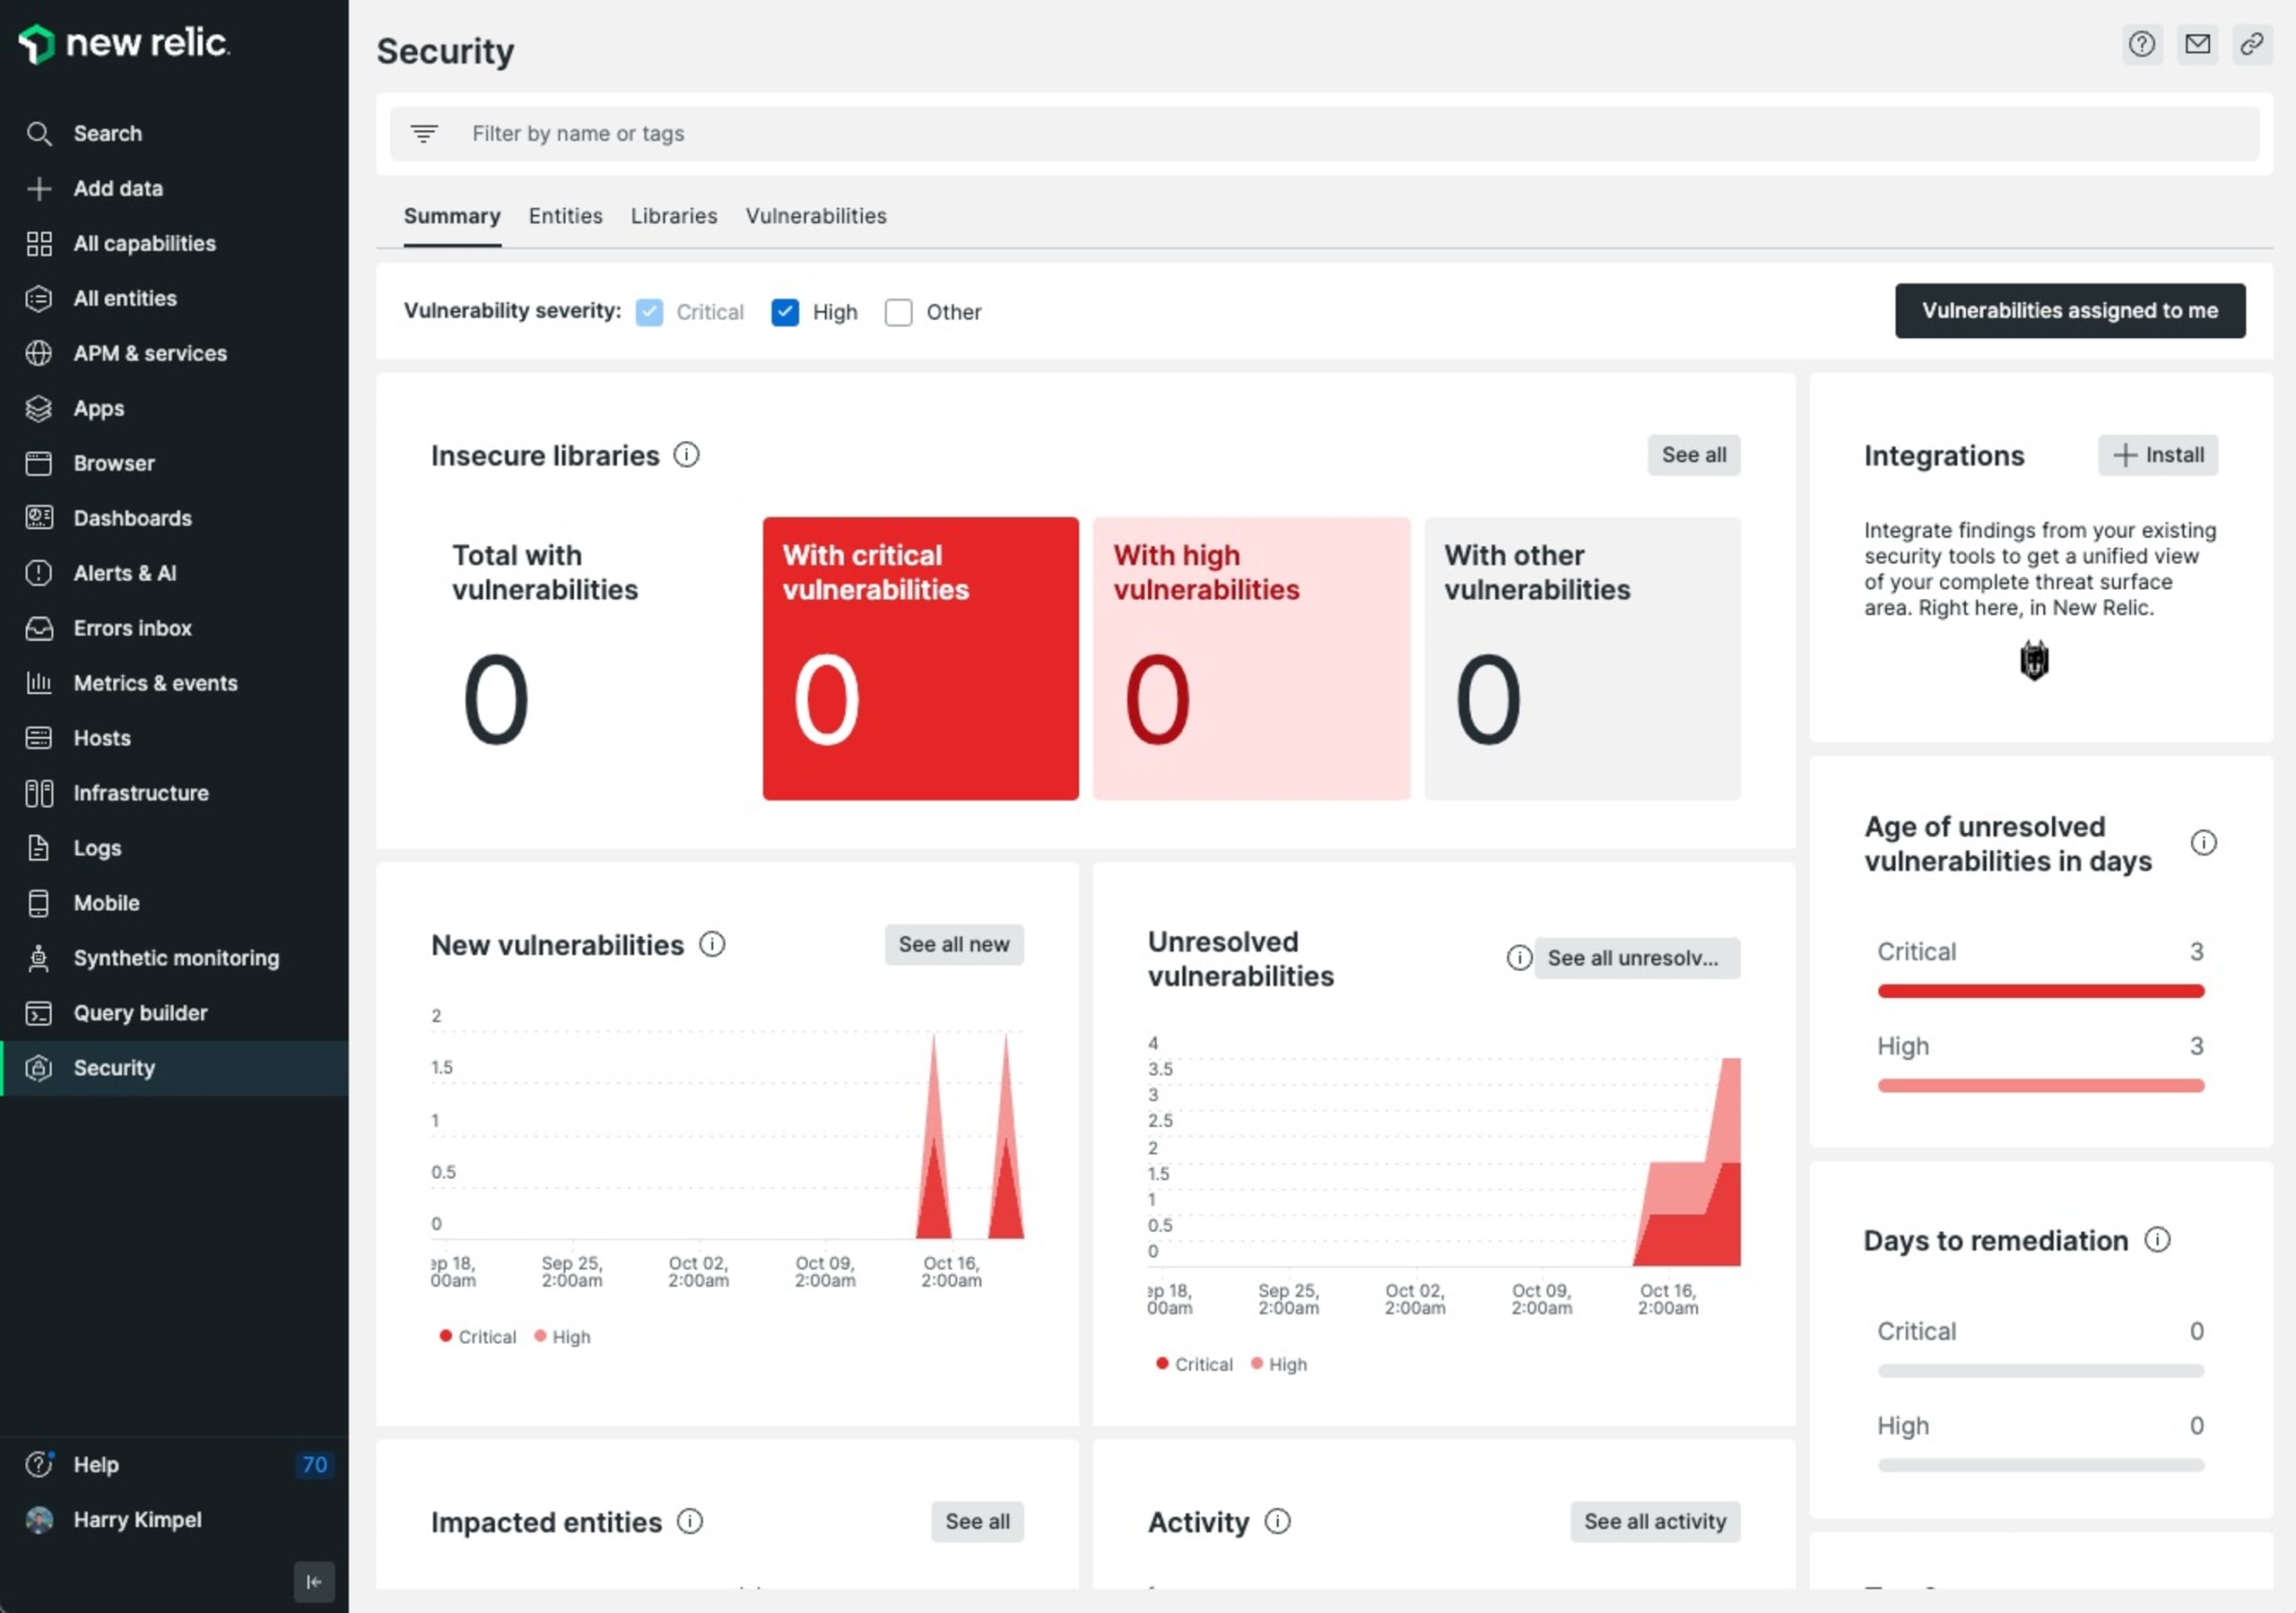
In addition to that, New Relic also provides a curated UI, a New Relic app named Vulnerability management, which you can use to visualize all the issues being sent.
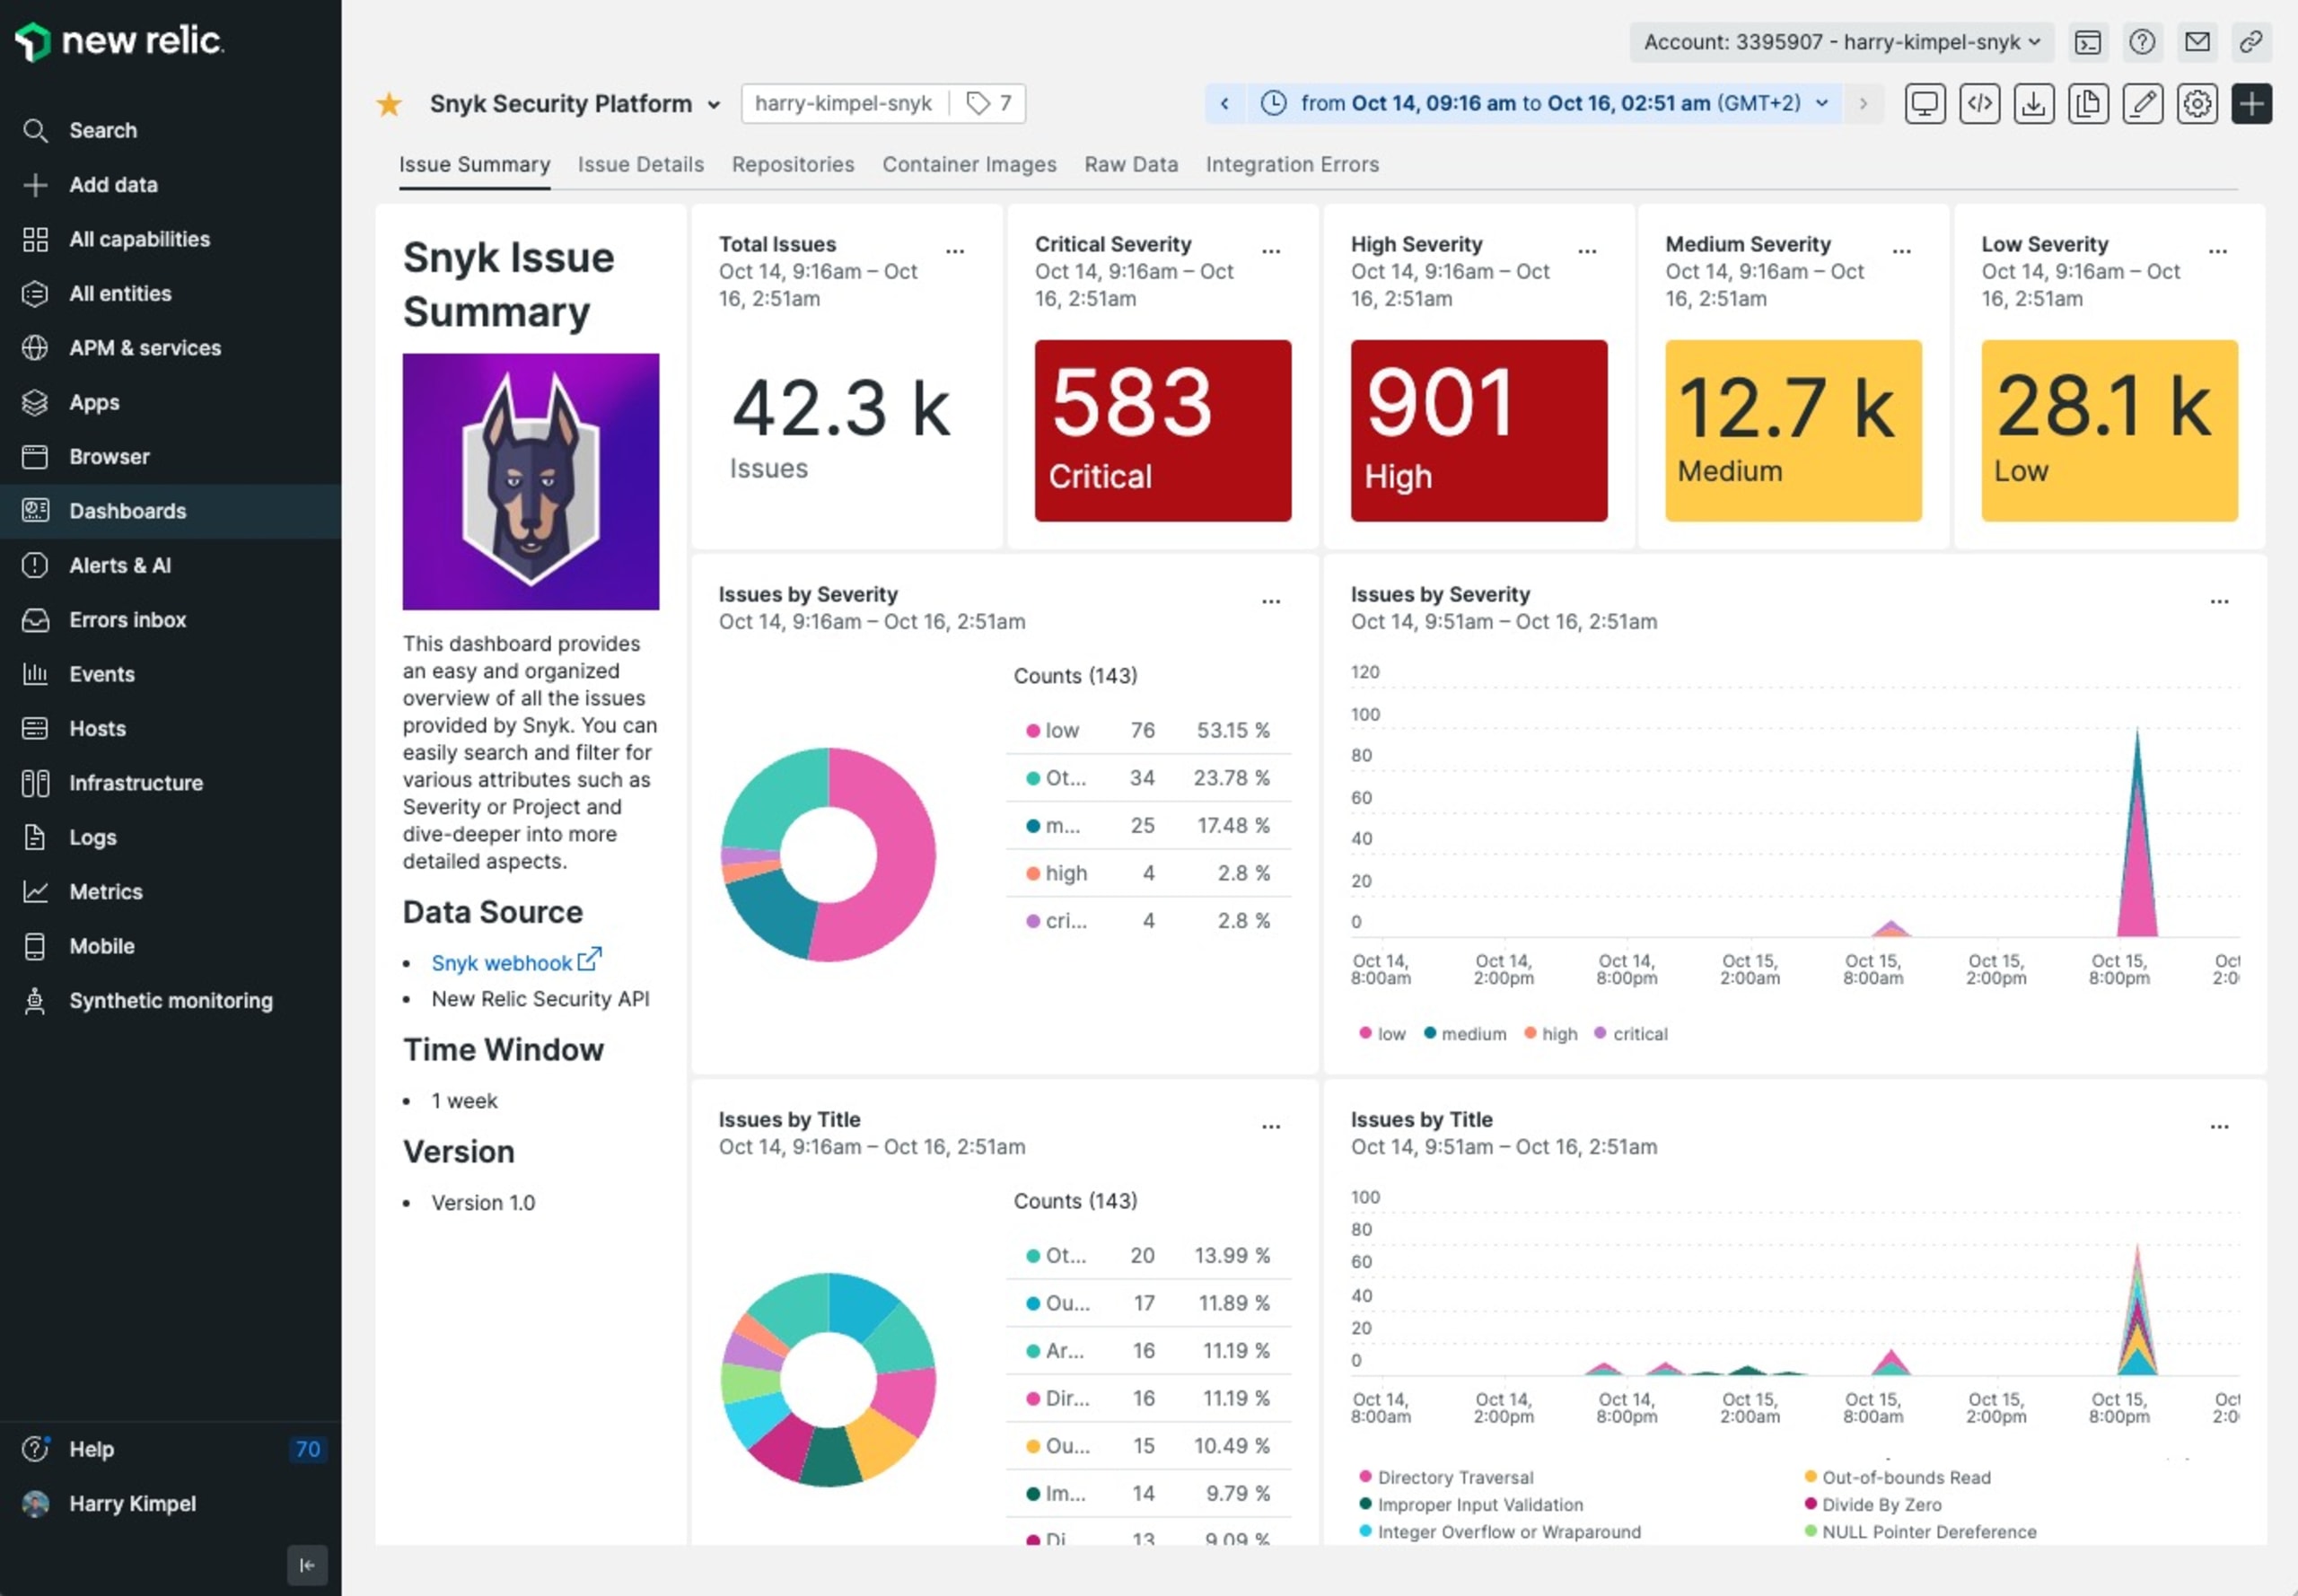
Furthermore, the Snyk team has also built a quickstart template that includes a sample custom dashboard to make sure all the data is presented in a Snyk-preferred way that focuses on prioritization and noise reduction.
Option 2: New Relic Events API using Snyk webhooks
This type of integration is leveraging New Relic’s generic way of ingesting any type of data in the form of events into the New Relic platform using the New Relic Events API.
The difference compared to the New Relic Security API option is that the payload does not need to be formatted in any way. New Relic accepts pretty much any payload (with some constraints around prerequisites and some Event API limits and restricted attributes).
An example Azure Function code is available in this repo. Please follow the steps from the New Relic Security API in order to create and set up the Azure Functions app on Microsoft Azure. In addition to that, please then also follow the steps to create the Snyk webhook.
Configure Azure Functions environment variables
Go into your Azure Functions App Configuration and add the following new application settings:
NEW_RELIC_INSIGHTS_URL: URL for the New Relic account’s event API, i.e. https://insights-collector.newrelic.com/v1/accounts/{NR-ACCOUNT-ID}/events
NEW_RELIC_LICENSE_KEY: New Relic license key

Sample dashboard
You can then validate that data is actually being ingested into New Relic by querying the data in the Events section.

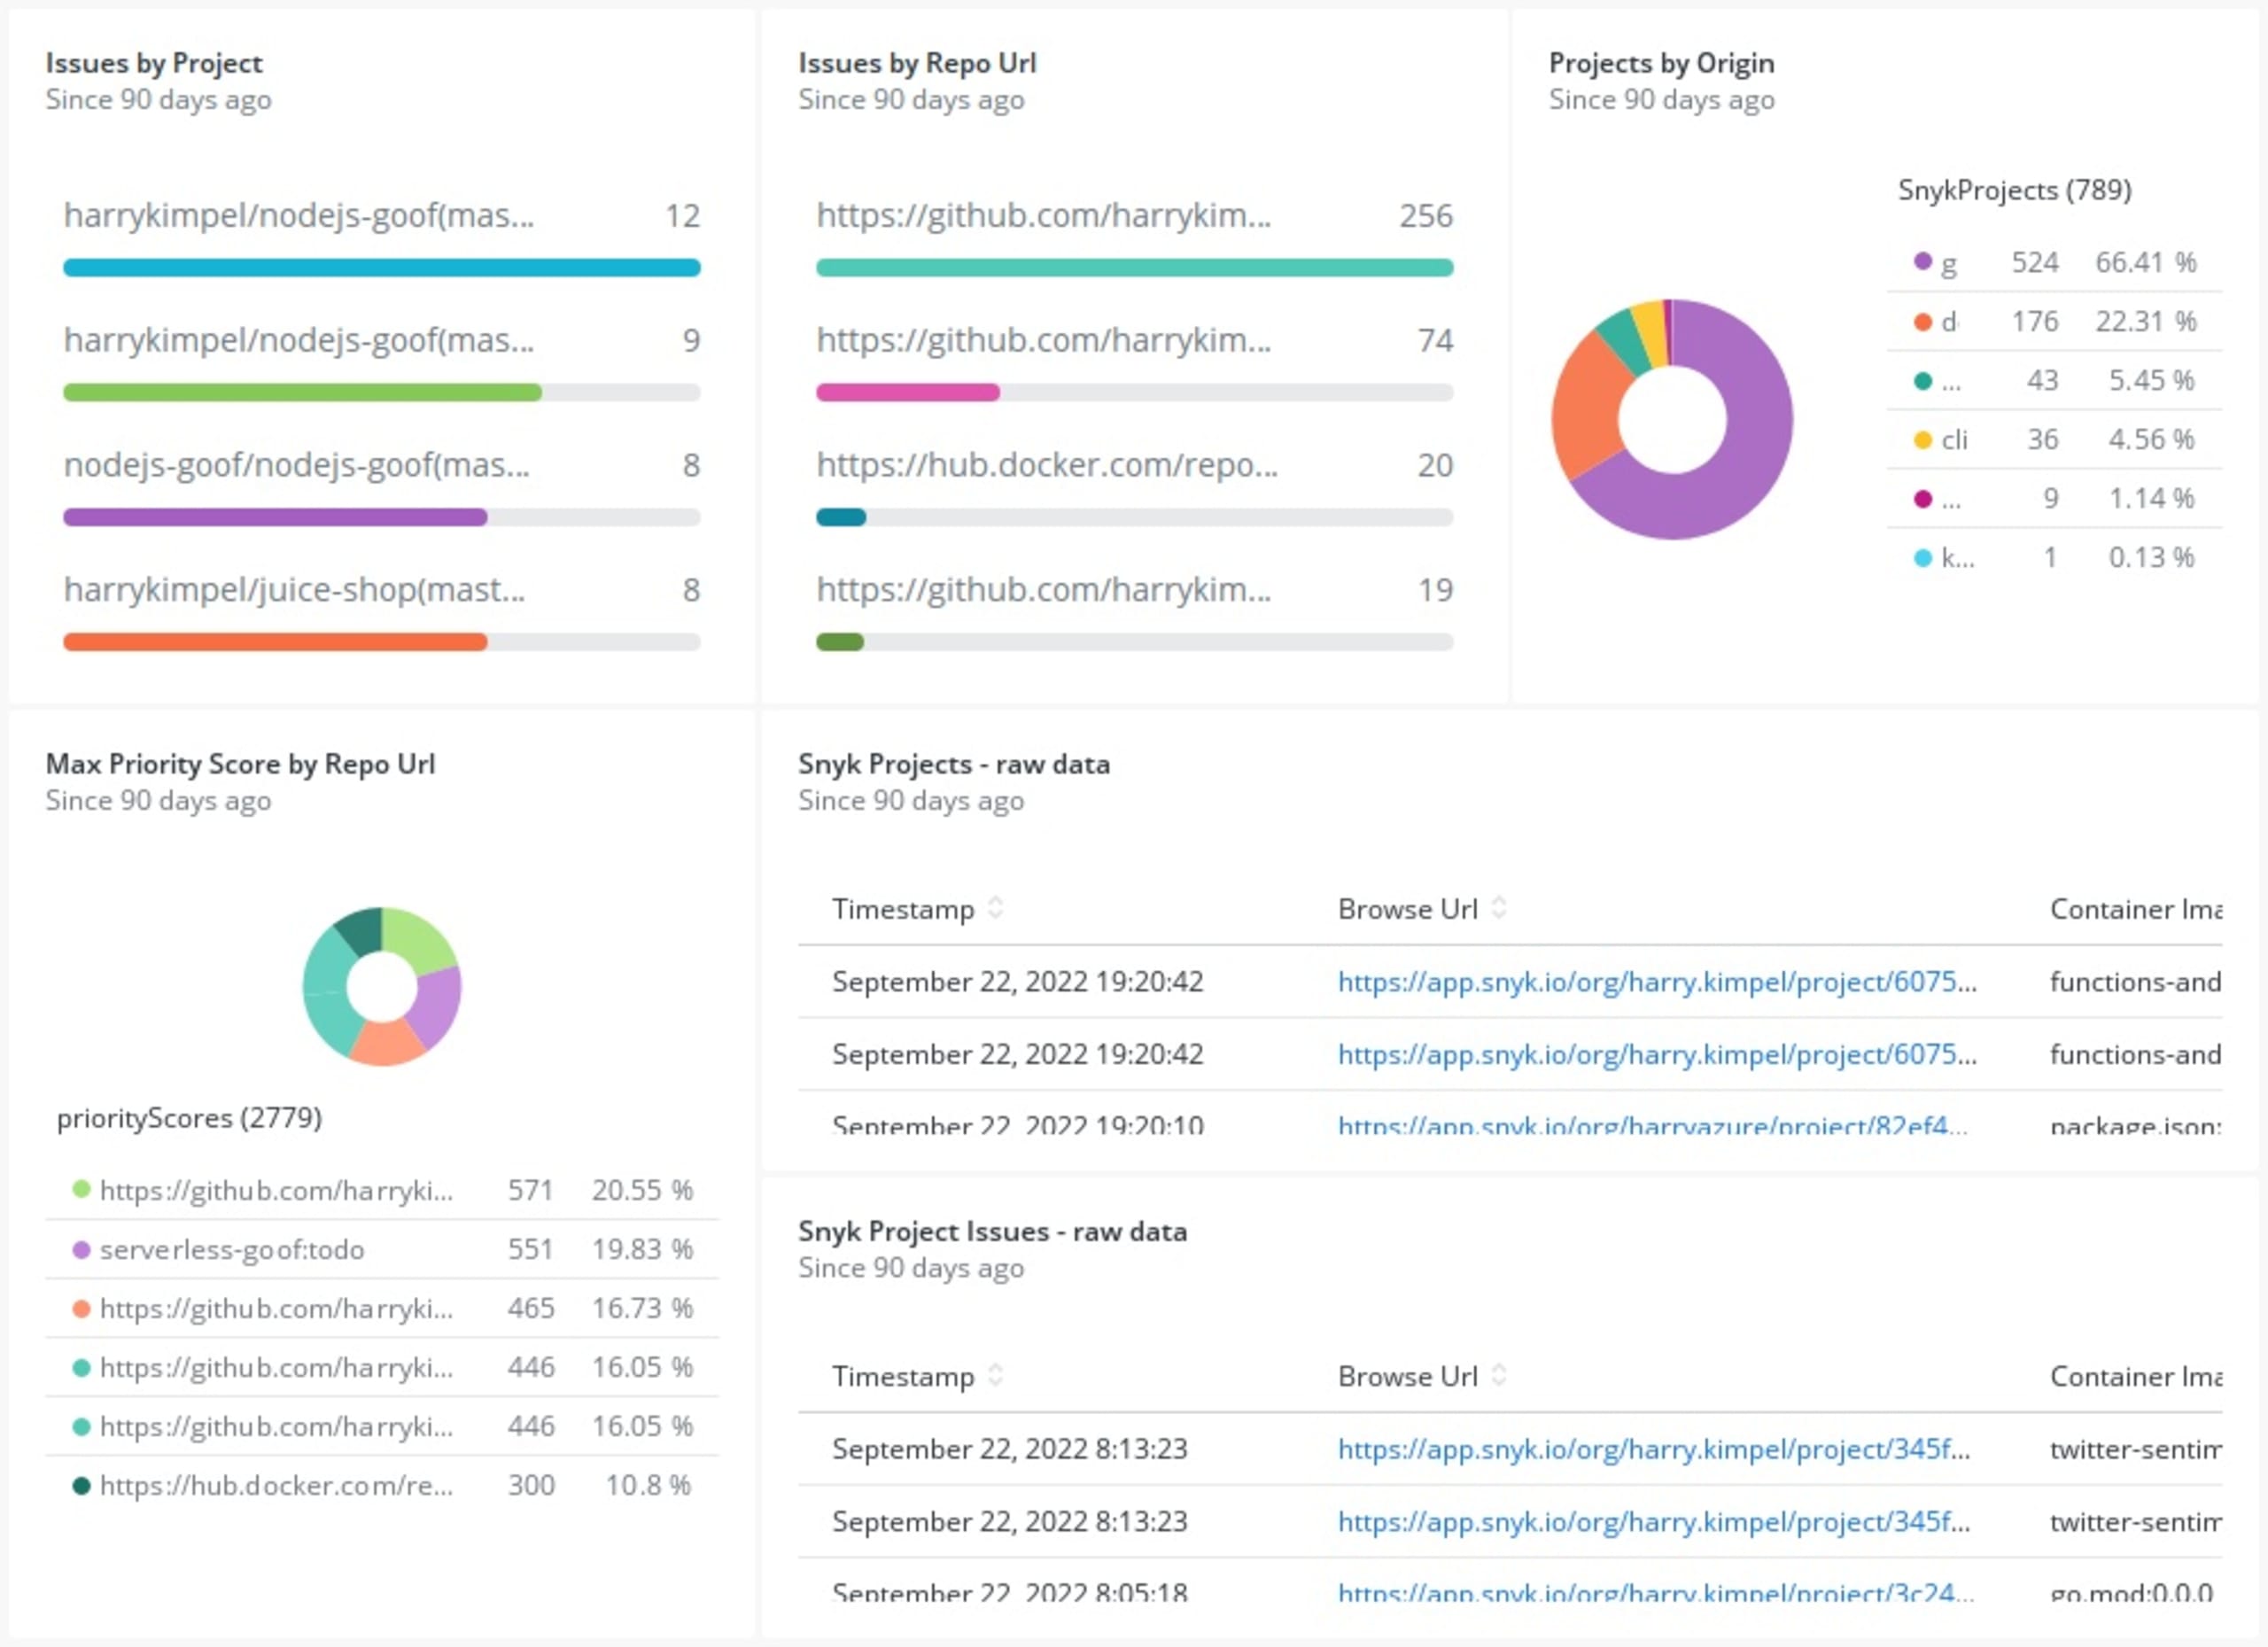
New Relic also allows you to visualize the data in a nice dashboard.
Option 3: New Relic Metrics API using Snyk exporter
Snyk exporter is an open source tool that allows for exporting scanning data into Prometheus metrics by scraping the Snyk HTTP API. This Prometheus exporter can easily be deployed into a Kubernetes cluster. This is the scenario described in this article. The exporter could also run outside of Kubernetes in a standalone fashion.
The use case in this article focuses on Kubernetes. The primary reason is that I want to leverage New Relic’s Prometheus OpenMetrics integrations for Docker and Kubernetes to scrape Prometheus endpoints and send the data to New Relic, so we can store and visualize crucial metrics on one platform.
Follow these deployment steps:
Deploy Snyk exporter
Snyk exporter already contains deployment YAMLs that you can adjust (secrets.yaml contains the API token for your Snyk account) and deploy using:
1kubectl apply -f examples/secrets.yaml
2
3kubectl apply -f examples/deployment.yaml
Deploy the New Relic Kubernetes integration
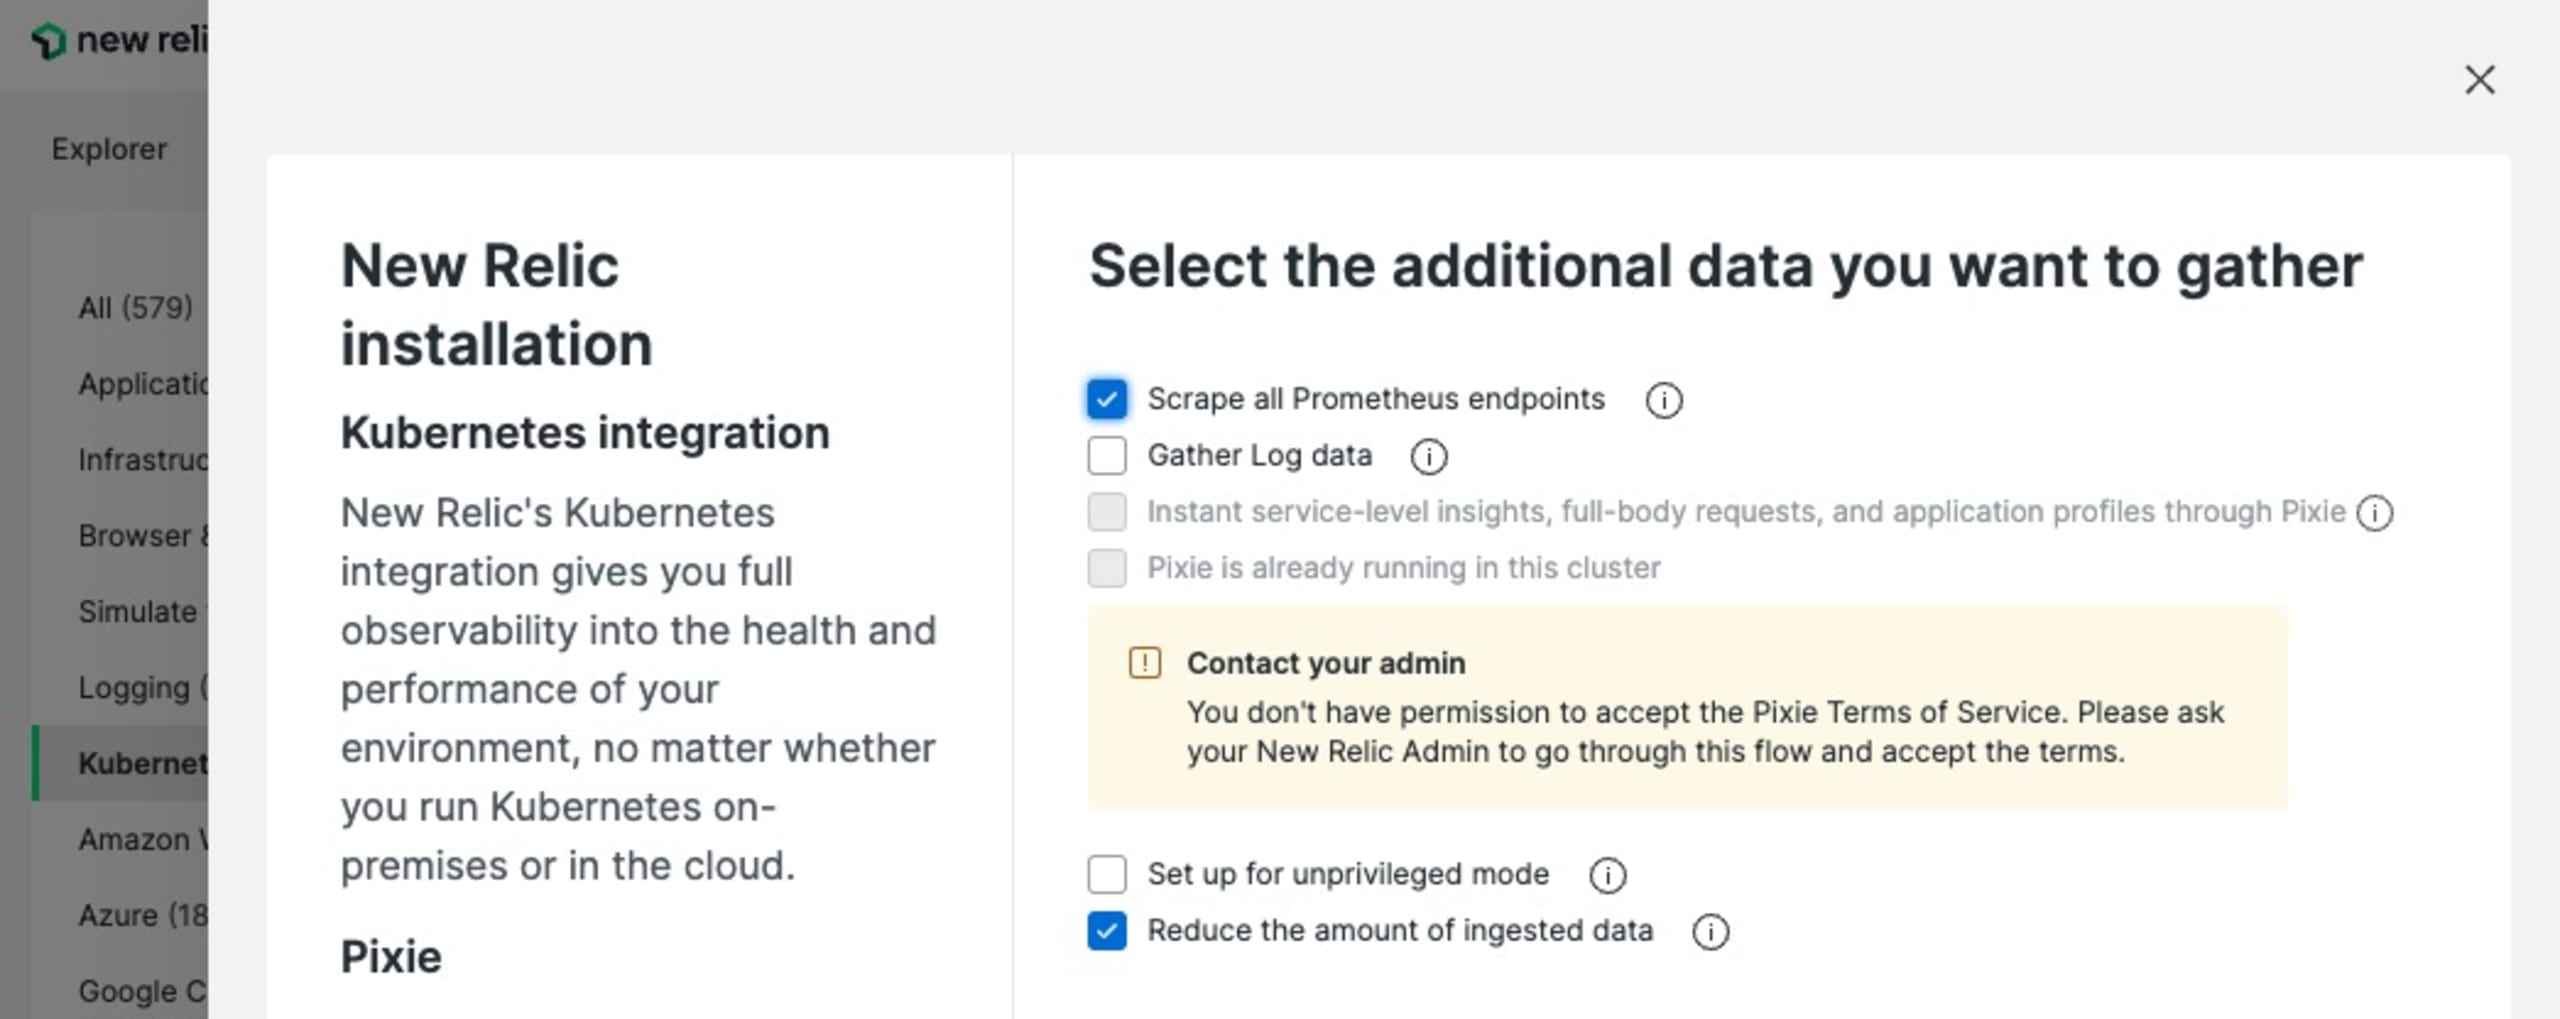
You can use New Relic’s guided install from the UI to configure a custom install and deploy script for the Kubernetes integration. Just make sure to check the option to scrape all Prometheus endpoints.
Visualize these metrics
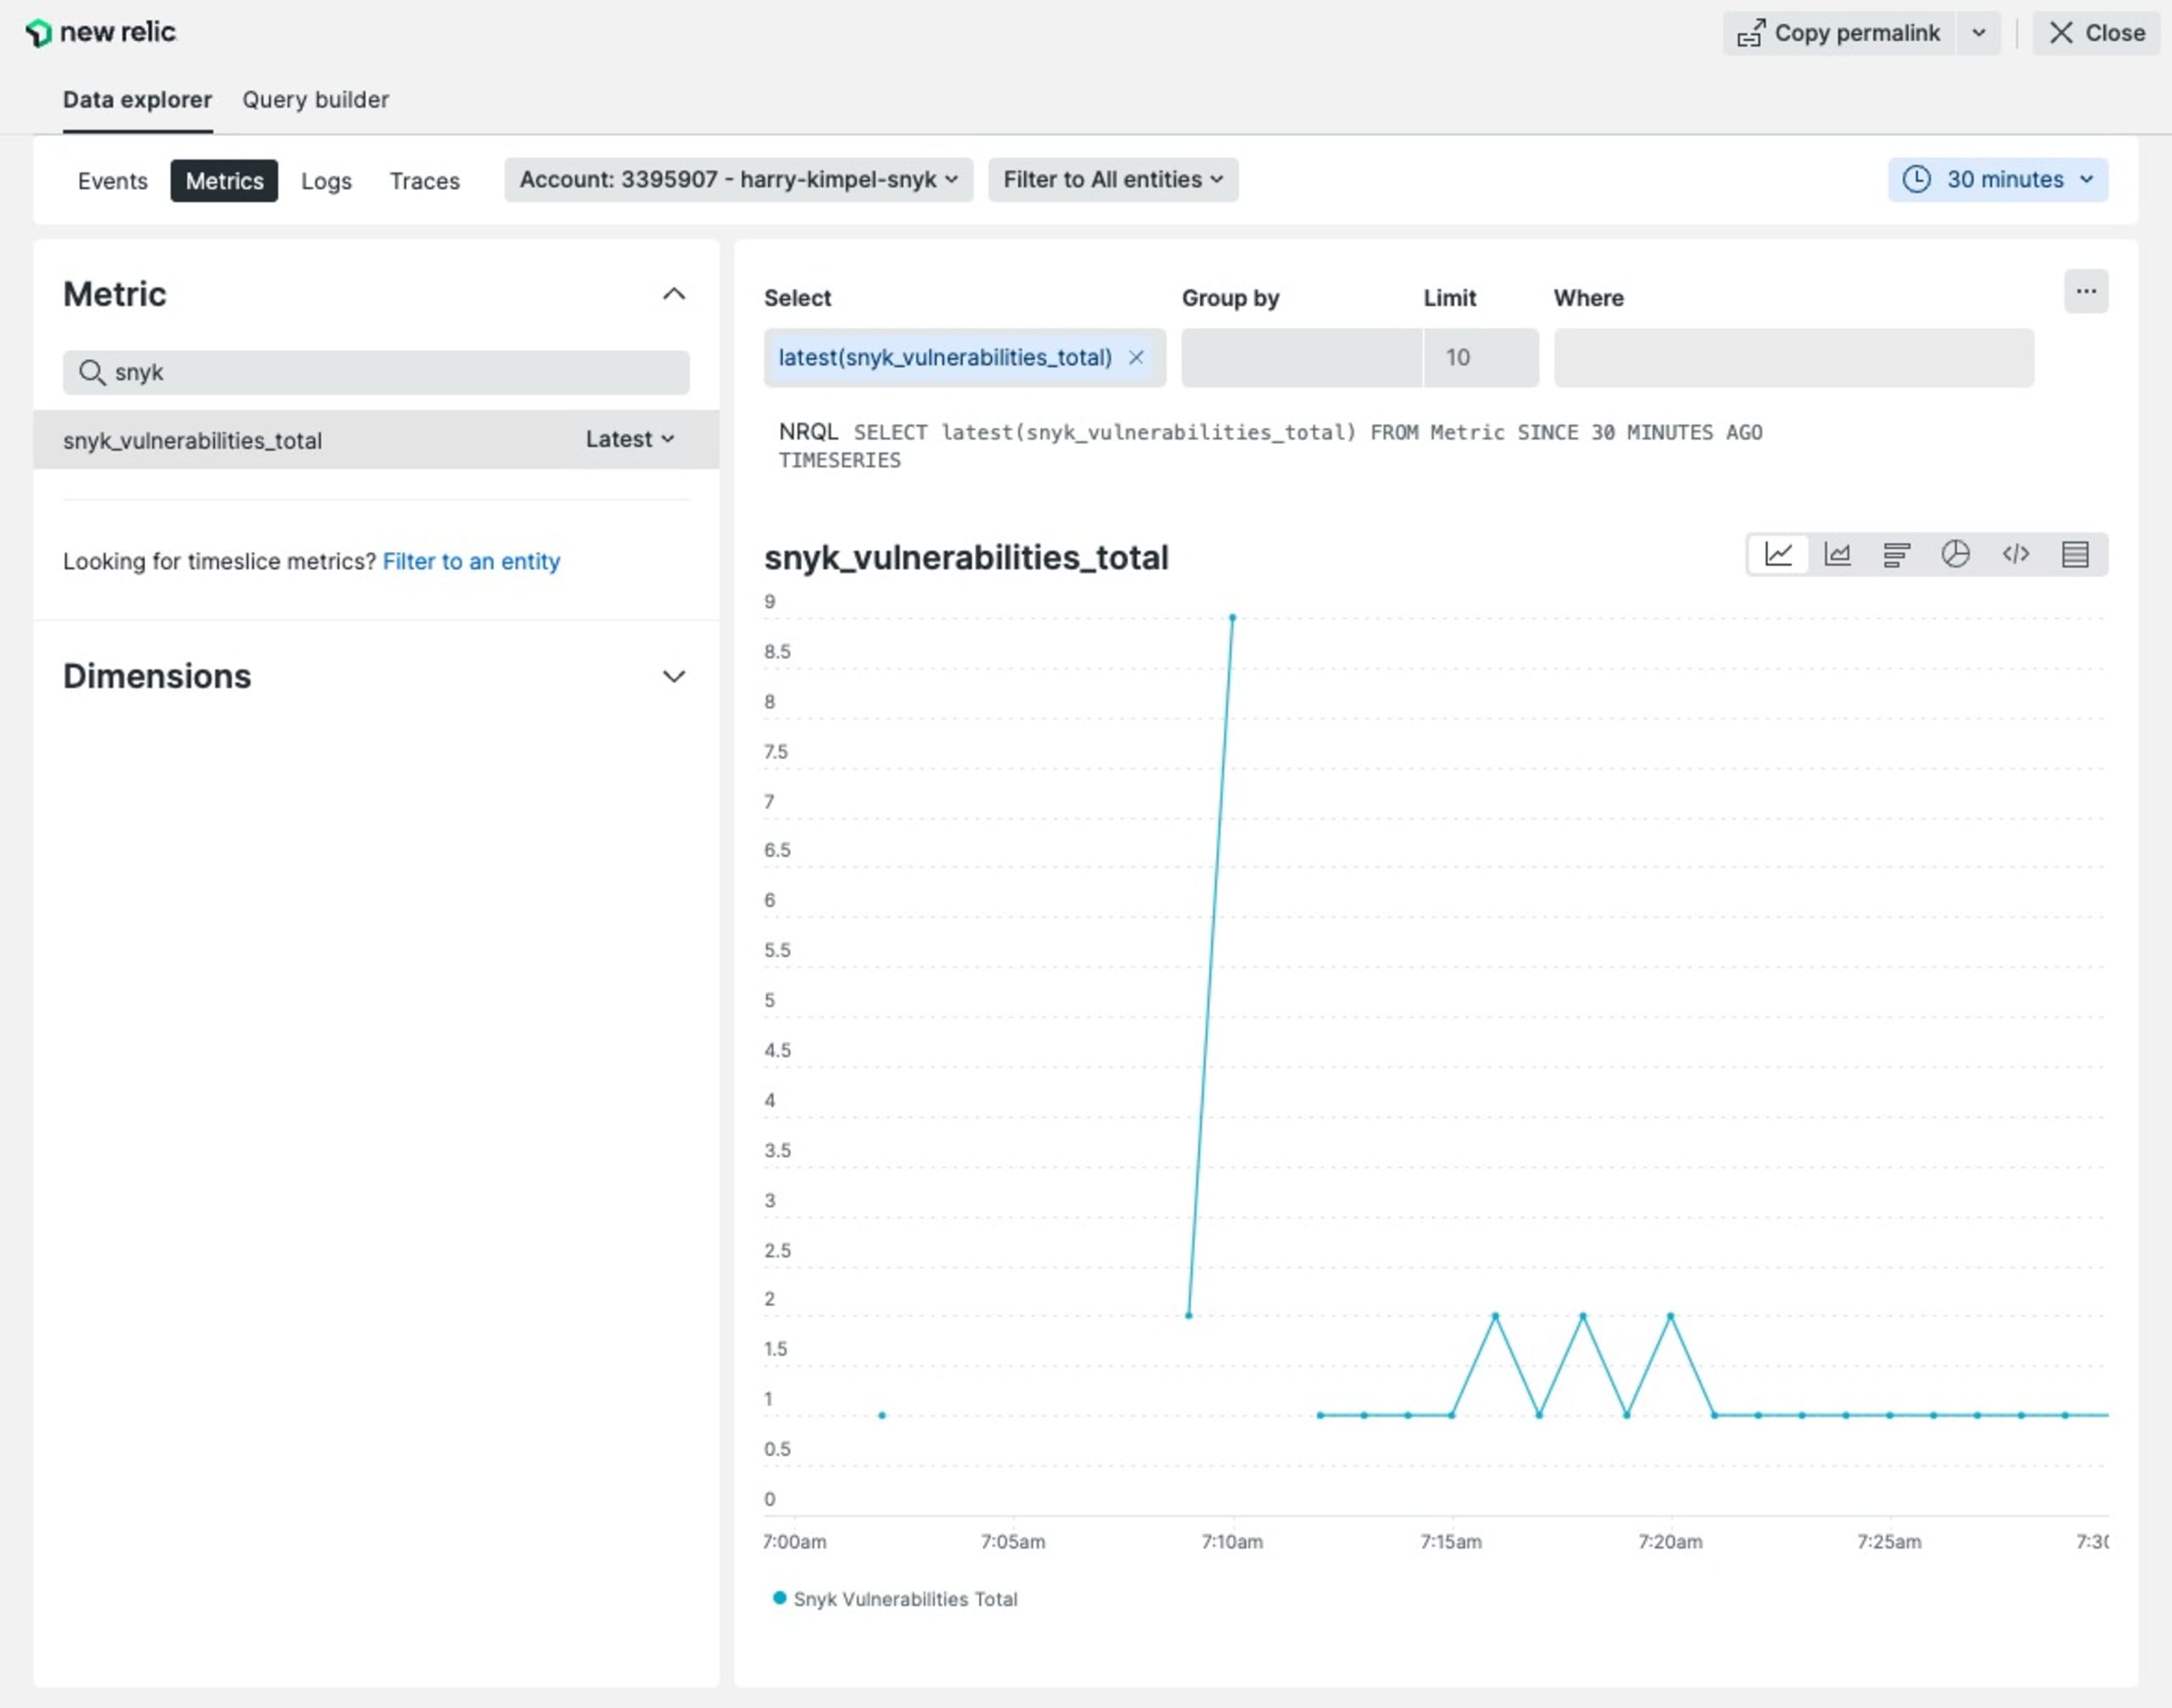
As soon as you deploy the New Relic Kubernetes integration you should see metrics from the Snyk exporter flowing in.
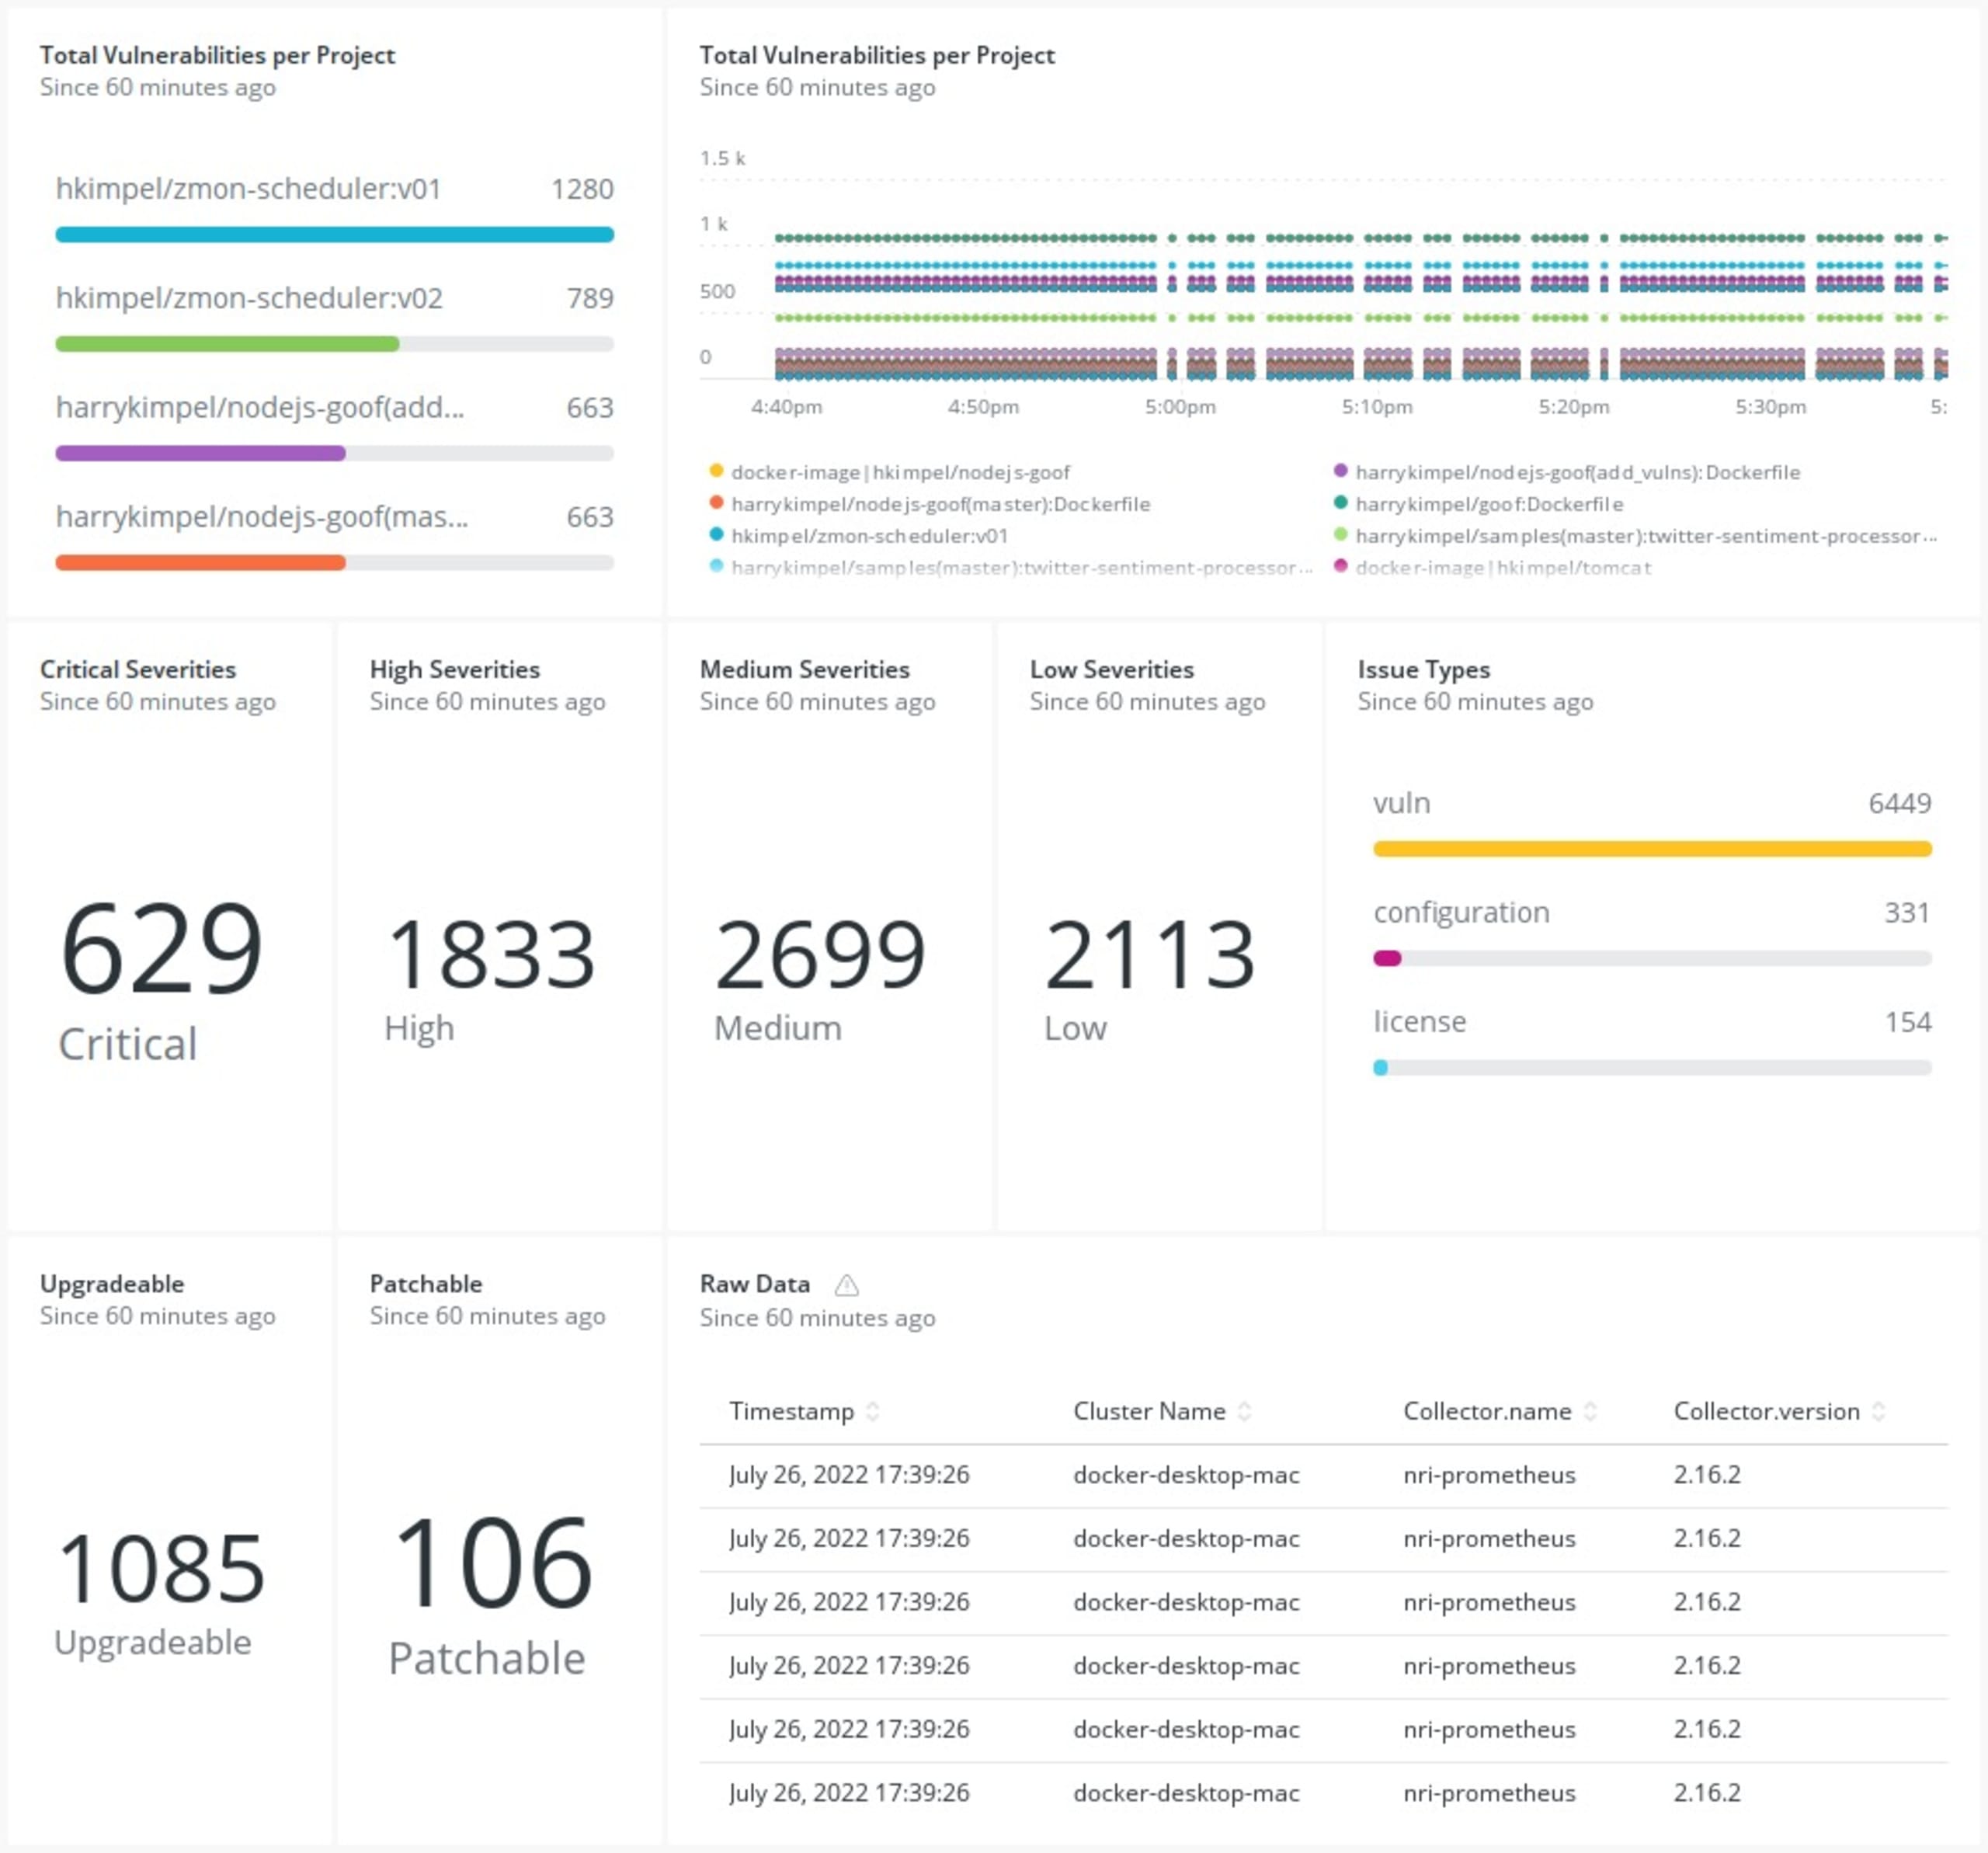
You don’t need to create your own dashboard to visualize these metrics, but can leverage a pre-built dashboard from the Snyk playground repo to import into your New Relic account.
Check out the dashboard
Once the quickstart is ready, you can go to your dashboards section within New Relic and look at the Snyk dashboard that you have imported, visualizing all the metrics from the Snyk exporter.
Observing security
And just like that, we’ve brought two sides of the same coin onto the same side of the same coin. That may not be how the saying goes, but all that matters is that you now have your logs, metrics, events, traces, and vulnerability data all available to you from a single pane of glass. Enjoy!
Encontre e corrija automaticamente as vulnerabilidades
A Snyk oferece solicitações de pull de correção em um clique e recomendações de correção para seu código, dependências, contêineres e infraestrutura na nuvem.
