How even quick Node.js async functions can block the Event-Loop
Michael Gokhman
4 de fevereiro de 2019
0 minutos de leituraA typical Node.js app is basically a collection of callbacks that are executed in reaction to various events: an incoming connection, I/O completion, timeout expiry, Promise resolution, etc. There is a single main thread (a.k.a the Event-Loop) that executes all these callbacks, and thus the callbacks should be quick to complete as all other pending callbacks are waiting for their turn. This is a known and challenging limitation of Node and is also nicely explained in the docs.
I recently stumbled upon a real event-loop blocking scenario here at Snyk. When I tried to fix the situation, I realized how little I actually knew about the event-loop behavior and gained some realizations that at first surprised me and some fellow developers I shared this with. I believe it’s important that as many Node developers will have this knowledge too - which led me to writing this article.
Plenty of valuable information already exists about the Node.js Event-Loop, but it took me time find the answers for the specific questions I wanted to ask. I’ll do my best to share the various questions I had, and share the answers I’ve found in various great articles, some fun experimentation and digging.
First, let’s block the Node.js Event-Loop!
Note:
Examples below use Node 10.9.0 on an Ubuntu 18.04 VM with 4 cores, running on a MacBook Pro 2017
You can play with the code bellow by cloning https://github.com/michael-go/node-async-block
So let’s start with a simple Express server:
and now let’s add a nasty event-loop blocking endpoint:
So we expect, that during the operation of the /compute-sync endpoint, requests to /healthcheck will stall. We can probe the /healthcheck with this bash one-liner:
It will probe the /healthcheck endpoint every second and timeout if it gets no response in 5 seconds.
Let’s try it:
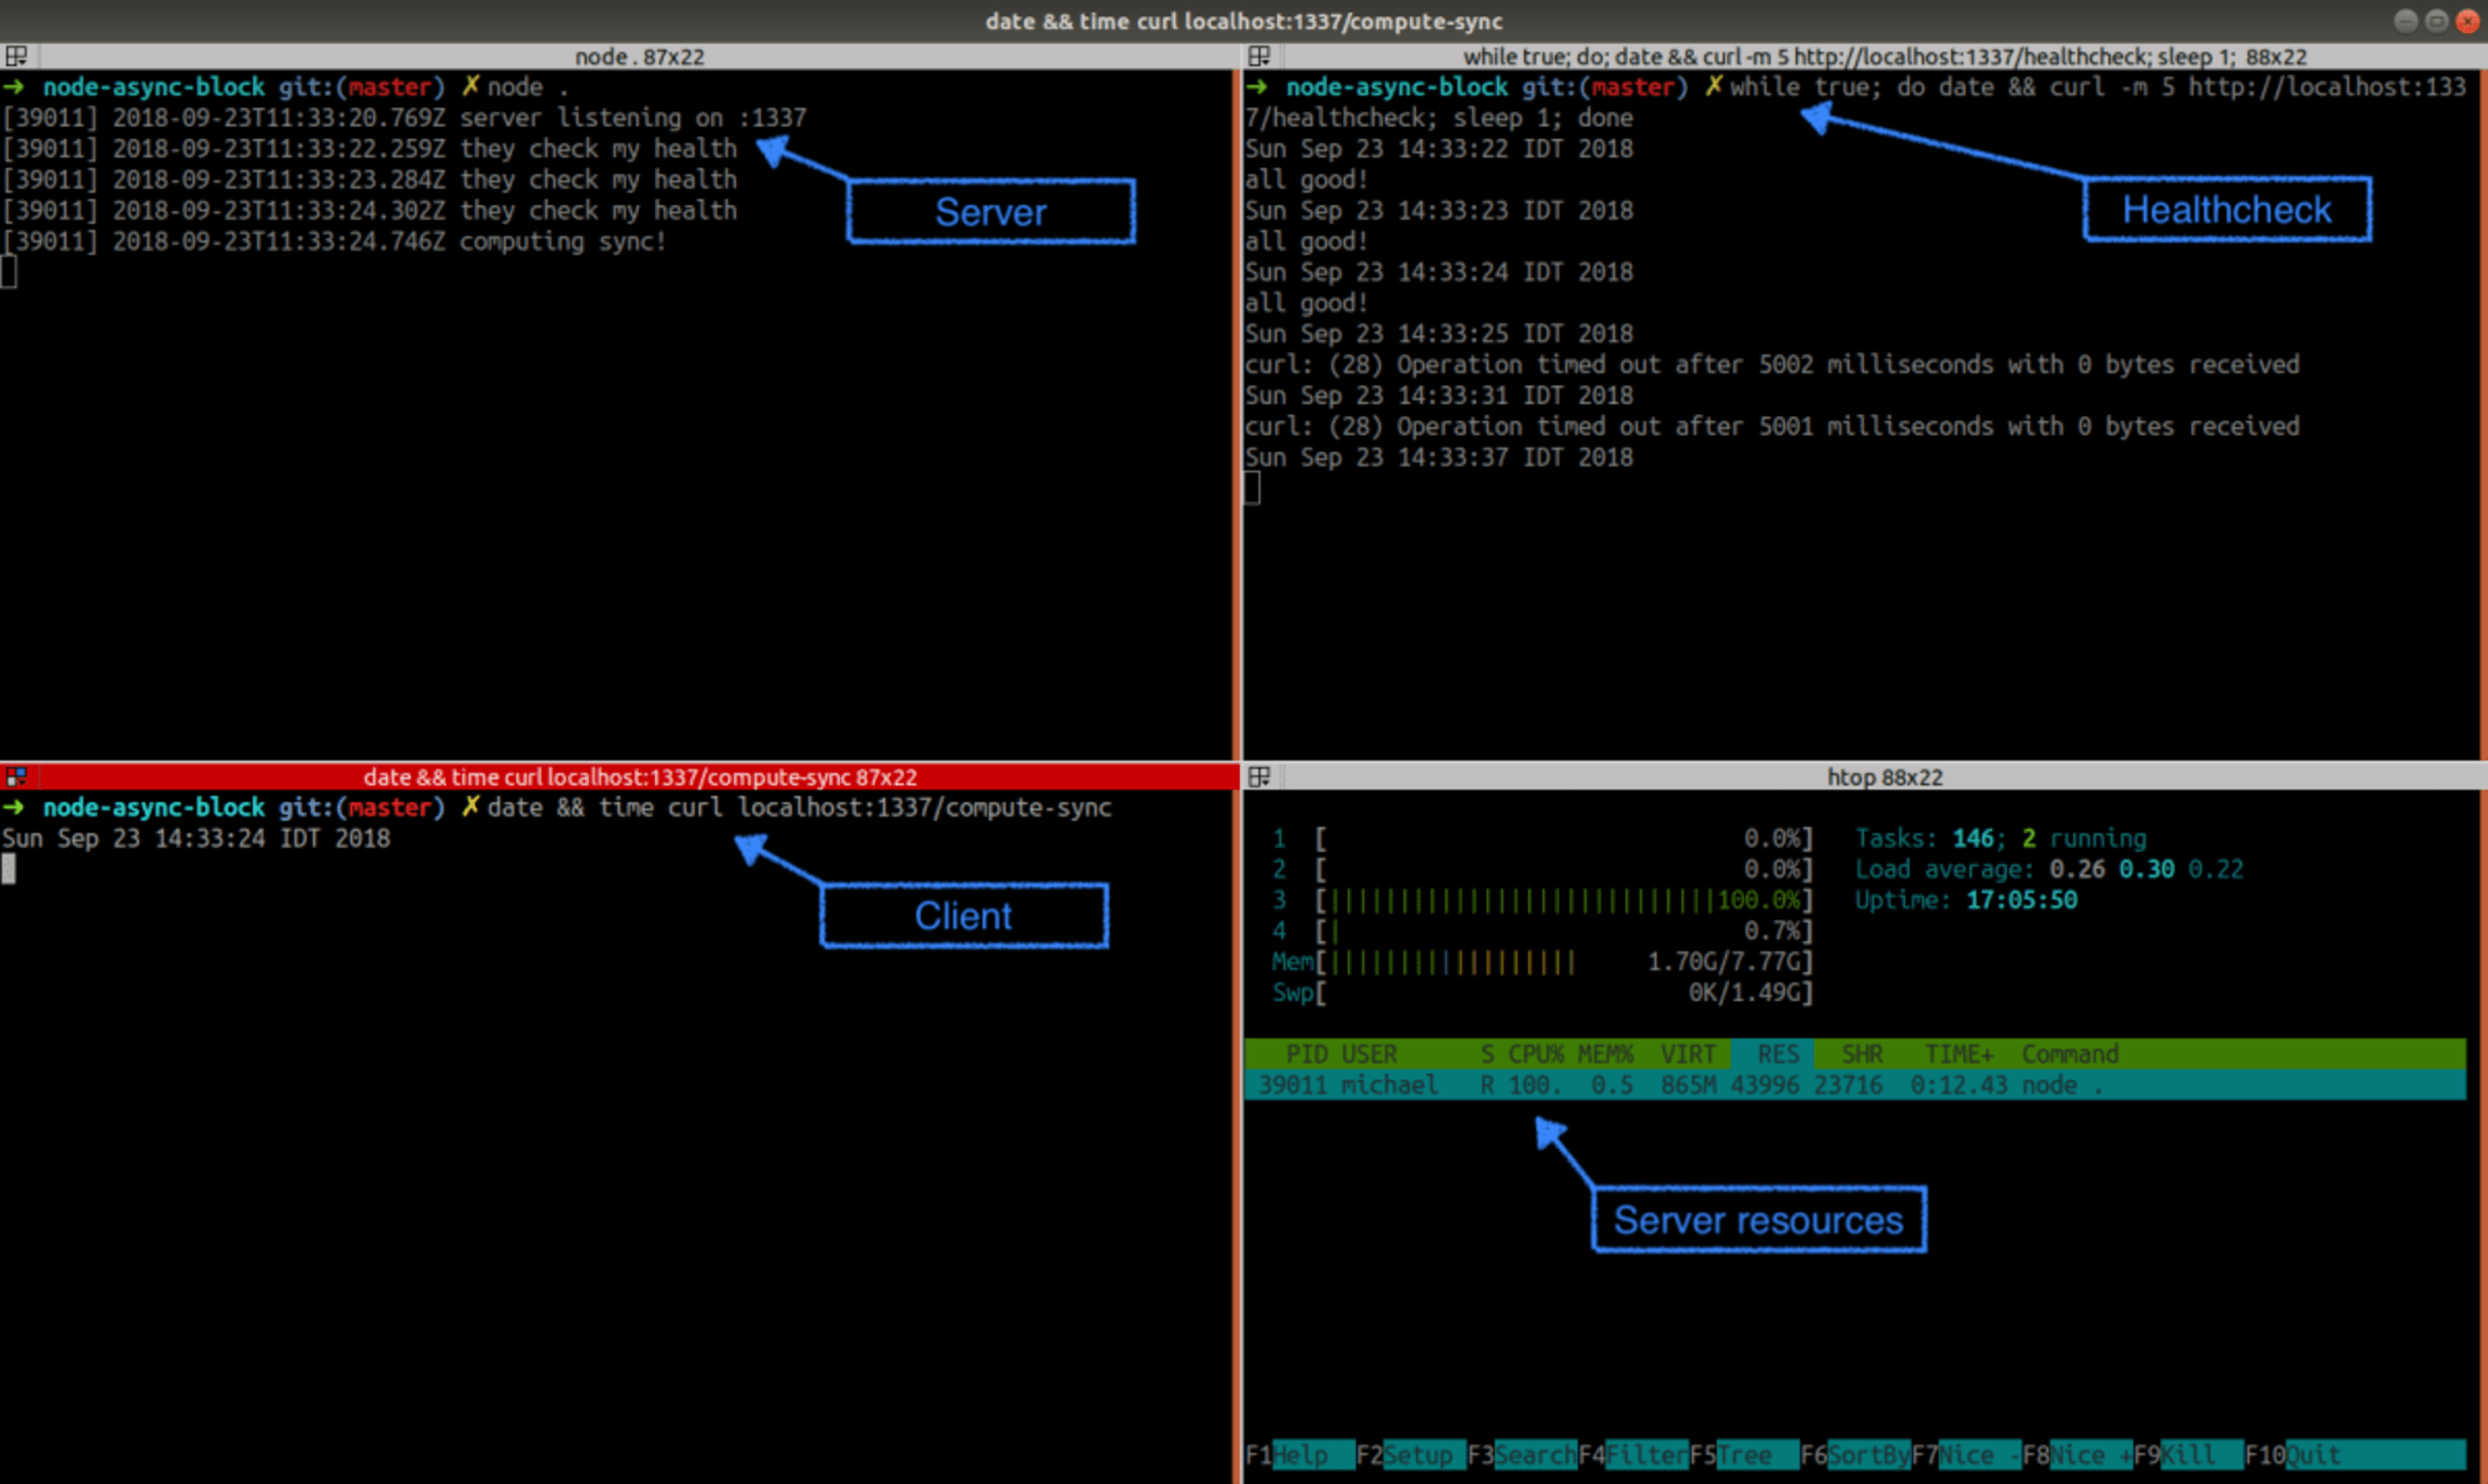
The moment we called the /compute-sync endpoint, the health-checks started to timeout and not a single one succeeded. Note that the node process is working hard at ~100% CPU.
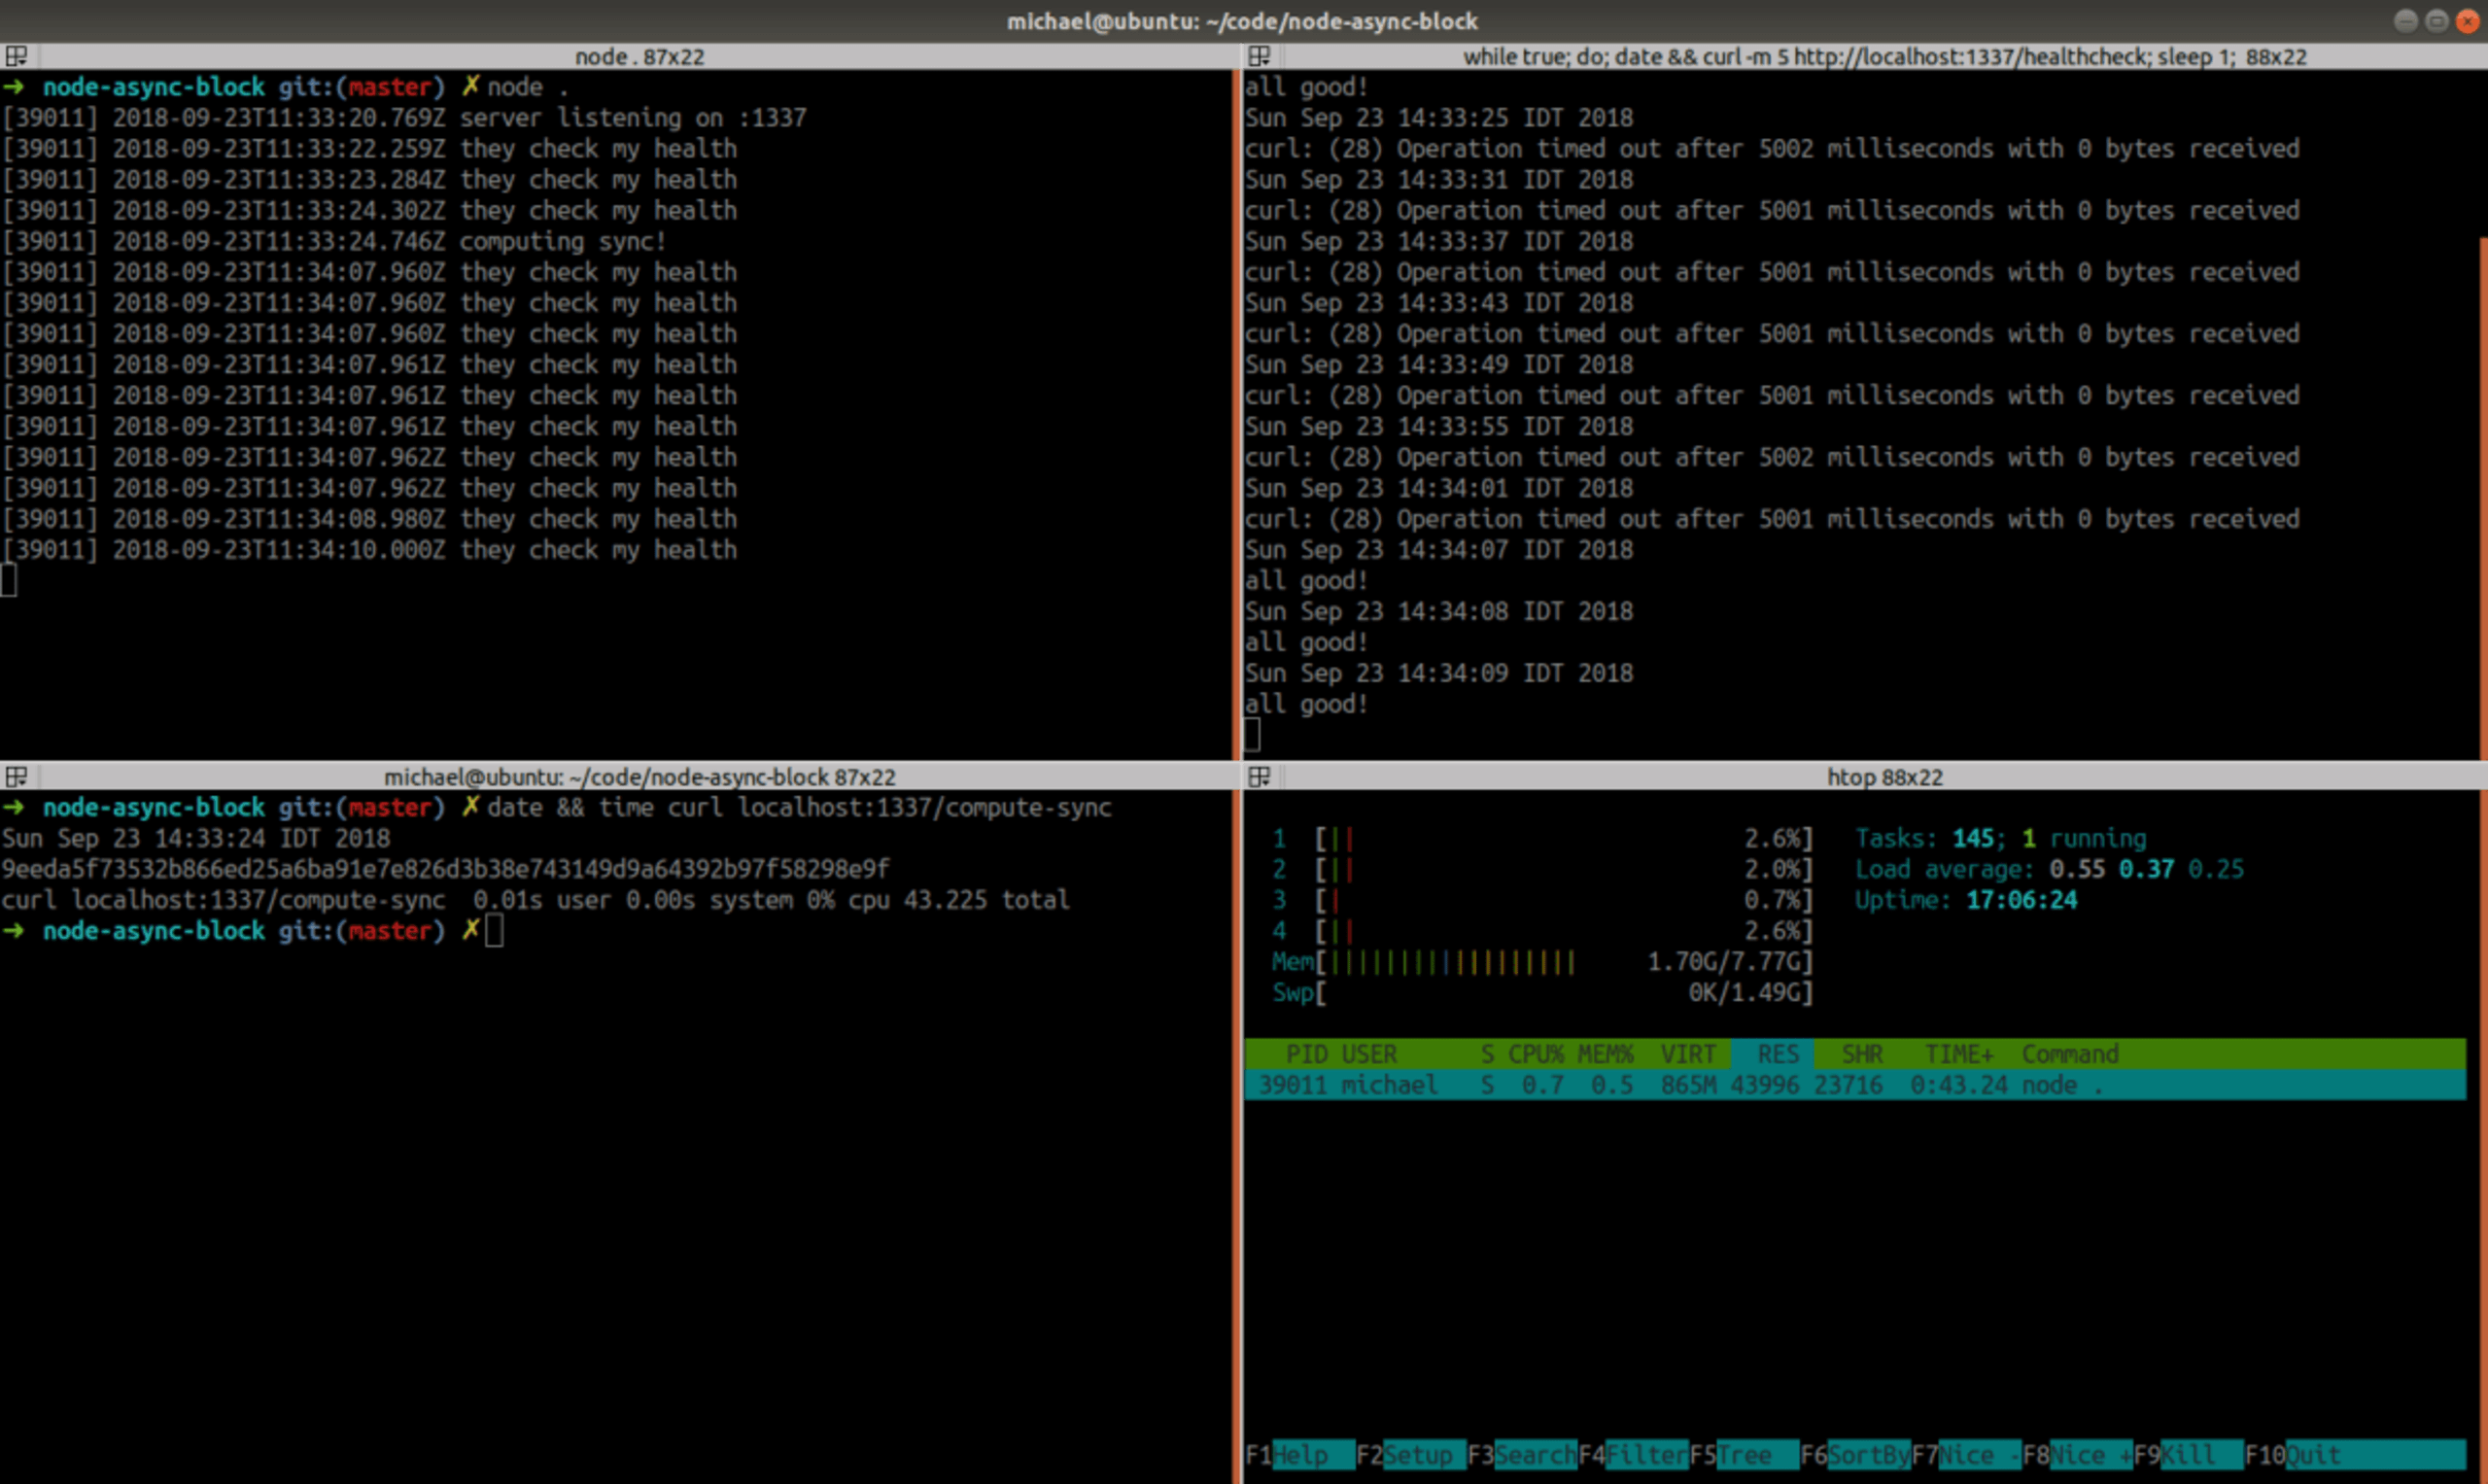
After 43.2 seconds the computation is over, 8 pending /healthcheck requests go through and the server is responsive again.
This situation is pretty bad — one nasty request blocks the server completely. Given the “single thread event loop” knowledge, it’s obvious why the code in /compute-sync blocked all other requests: before it completed it didn’t give the control back to the event-loop scheduler so there was no chance for the/healthcheck handler to run.
Let’s unblock it!
Let’s add a new endpoint /compute-async where we’ll partition the long blocking loop by yielding the control back to the event-loop after every computation step (too much context switching? maybe… we can optimize later and yield only once every X iterations, but let’s start simple):
Let’s try:
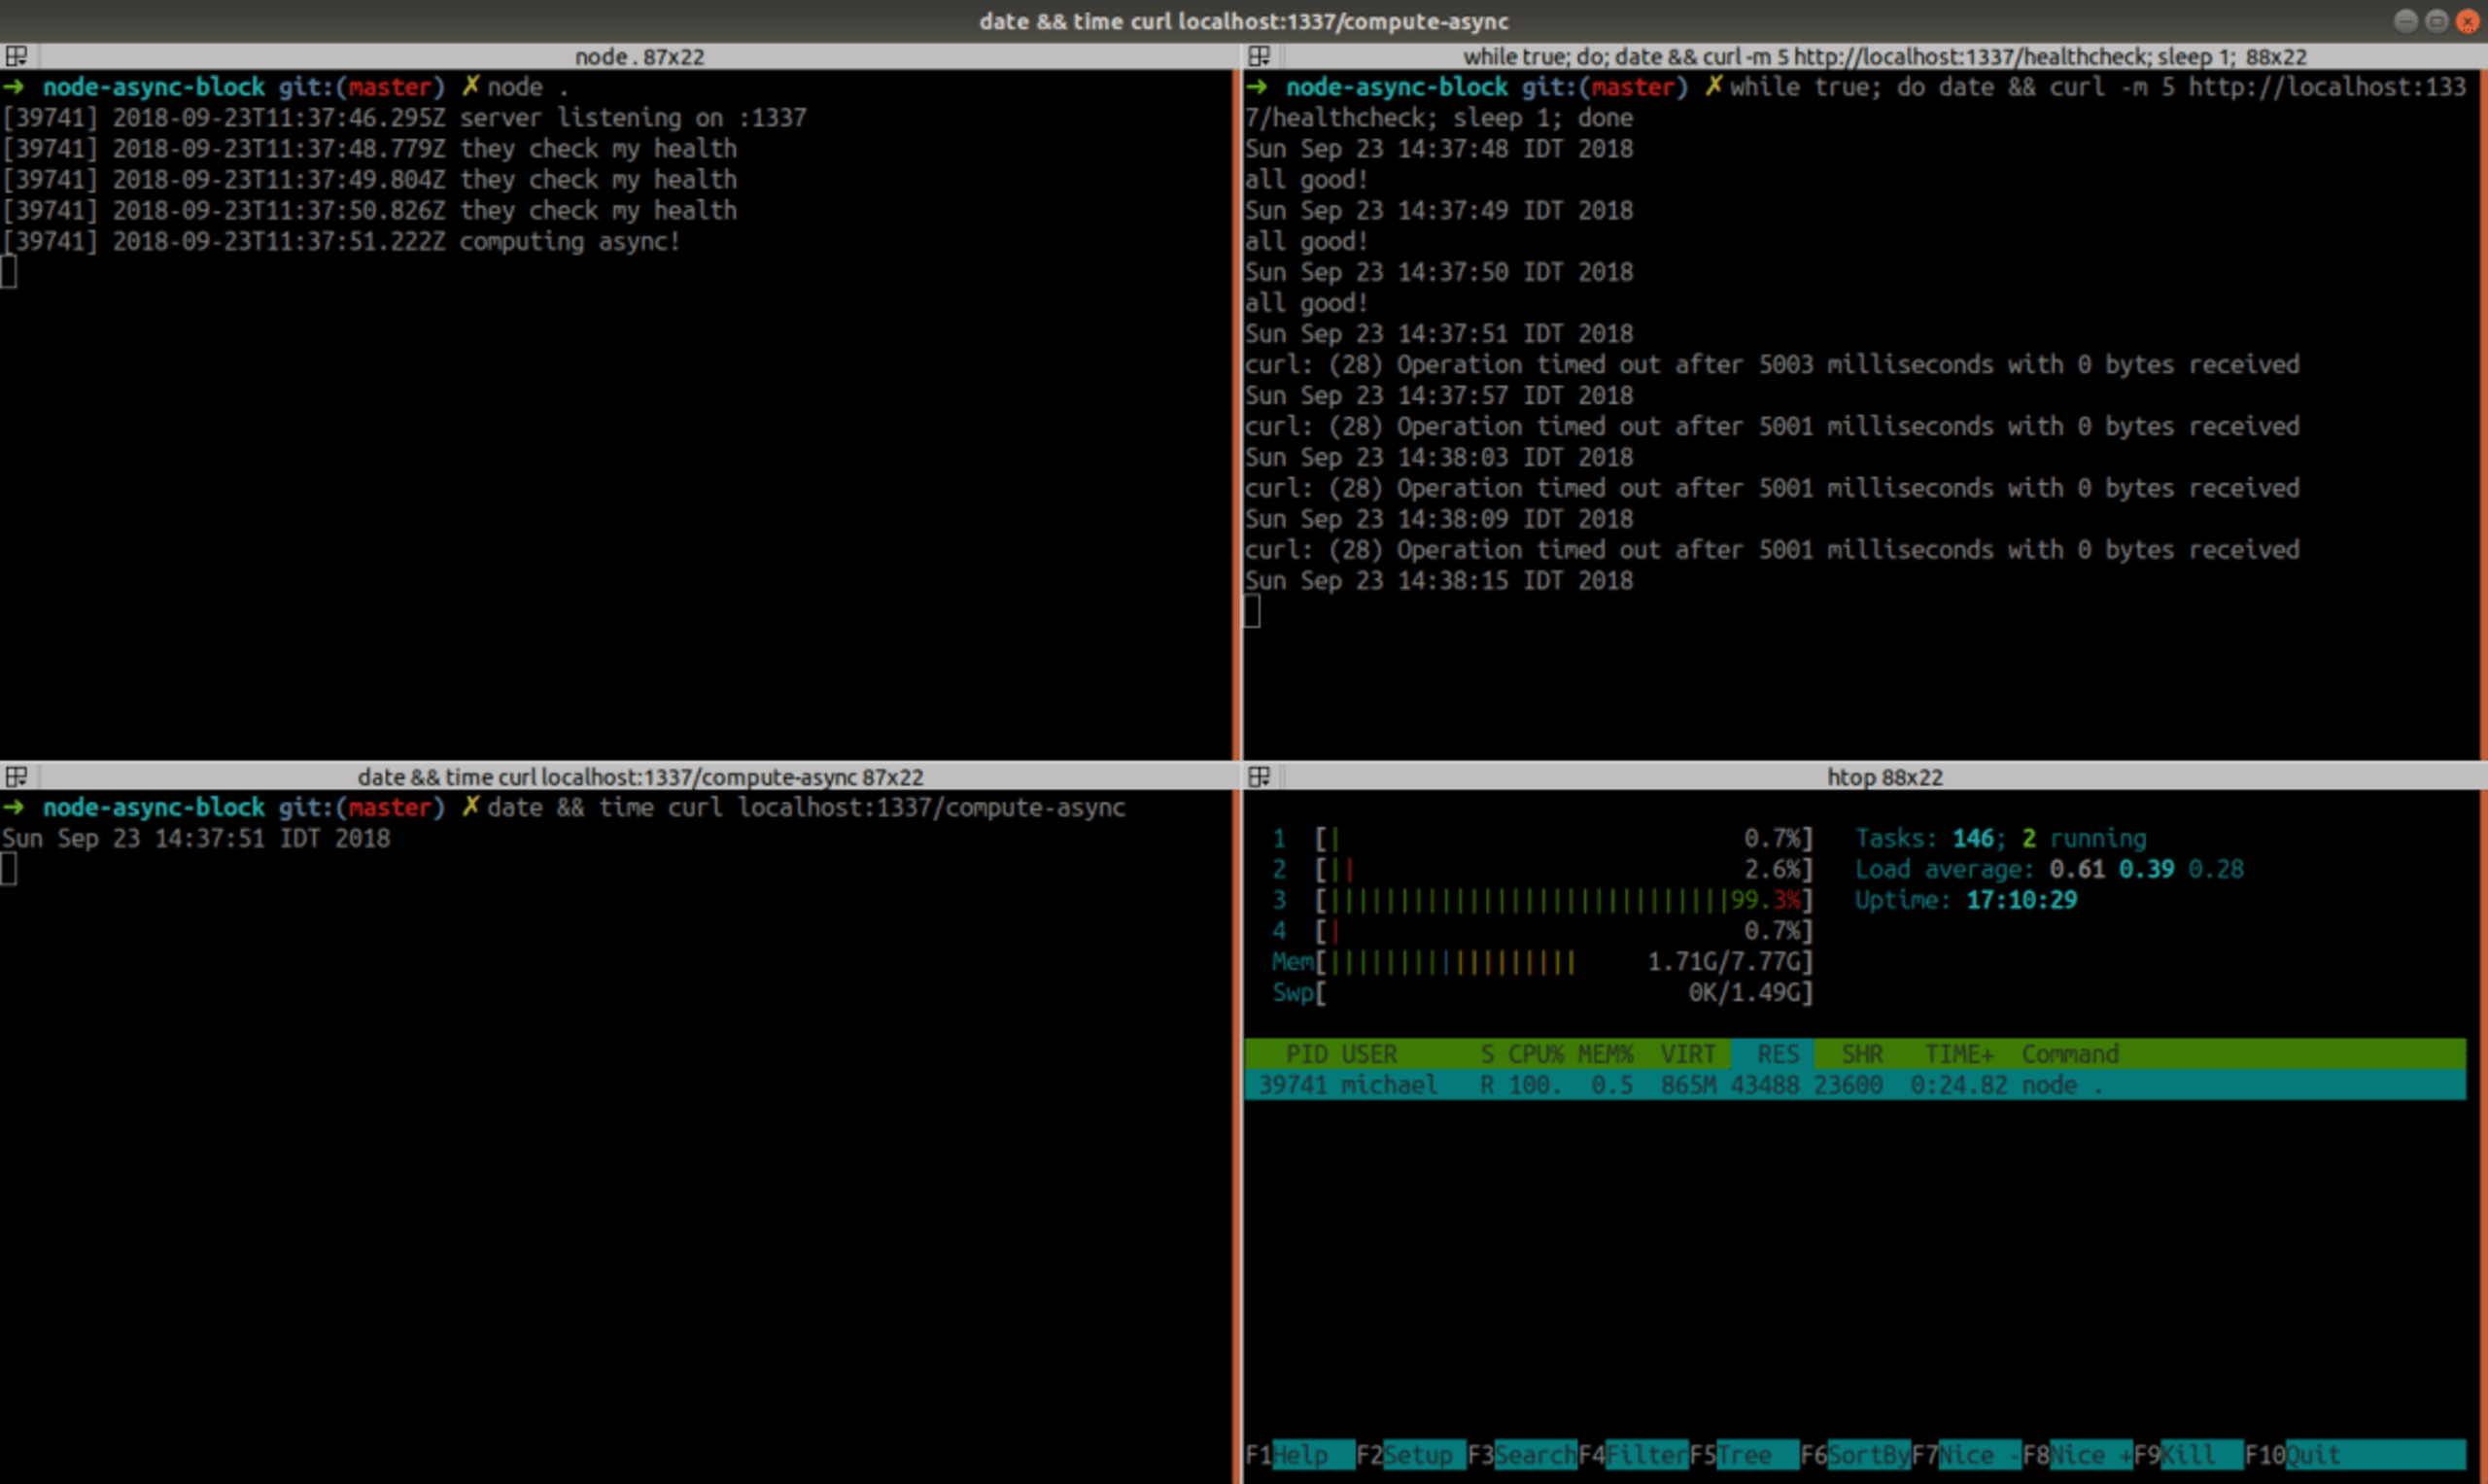
hmm …. it still blocks the event-loop?
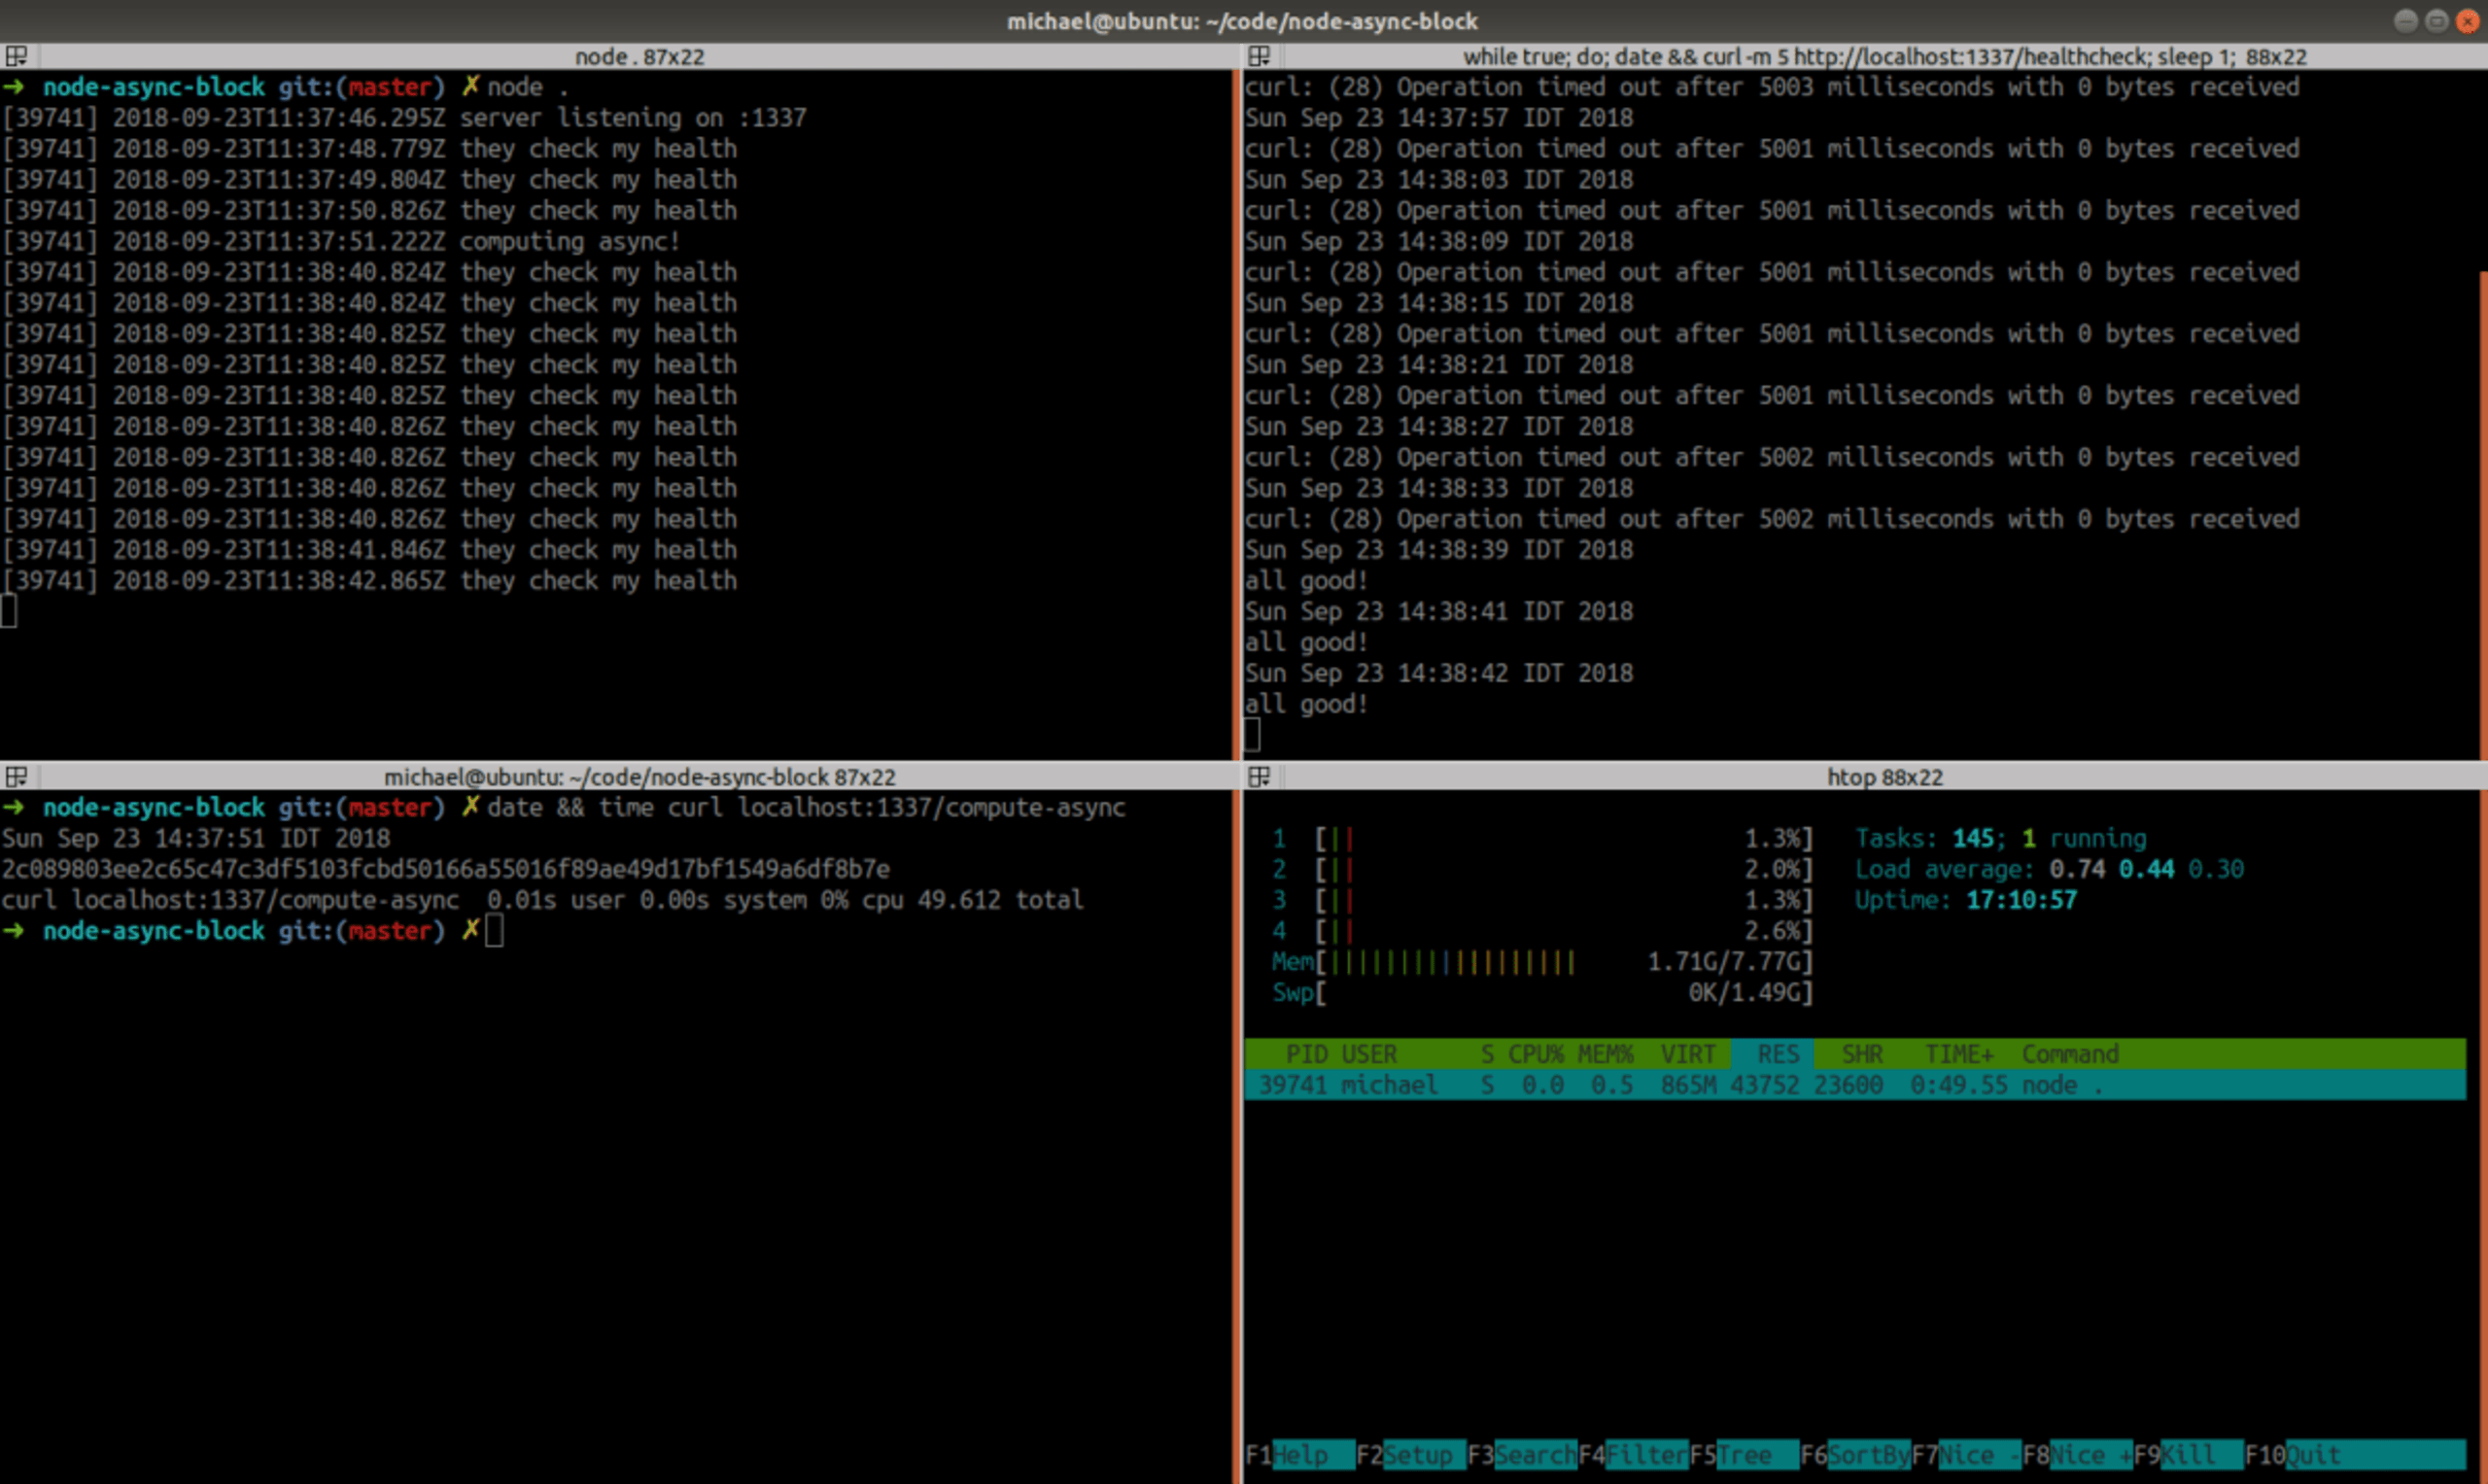
What’s going on here? Does Node.js optimizes-away our toy use of async/await here? It took few more seconds to complete, so doesn’t seem so… Flame-graphs can give a hint if asyncwas actually in-affect. We can use this cool GitHub project to generate flame-graphs easily:
First, the flame-graph captured while running /compute-sync:
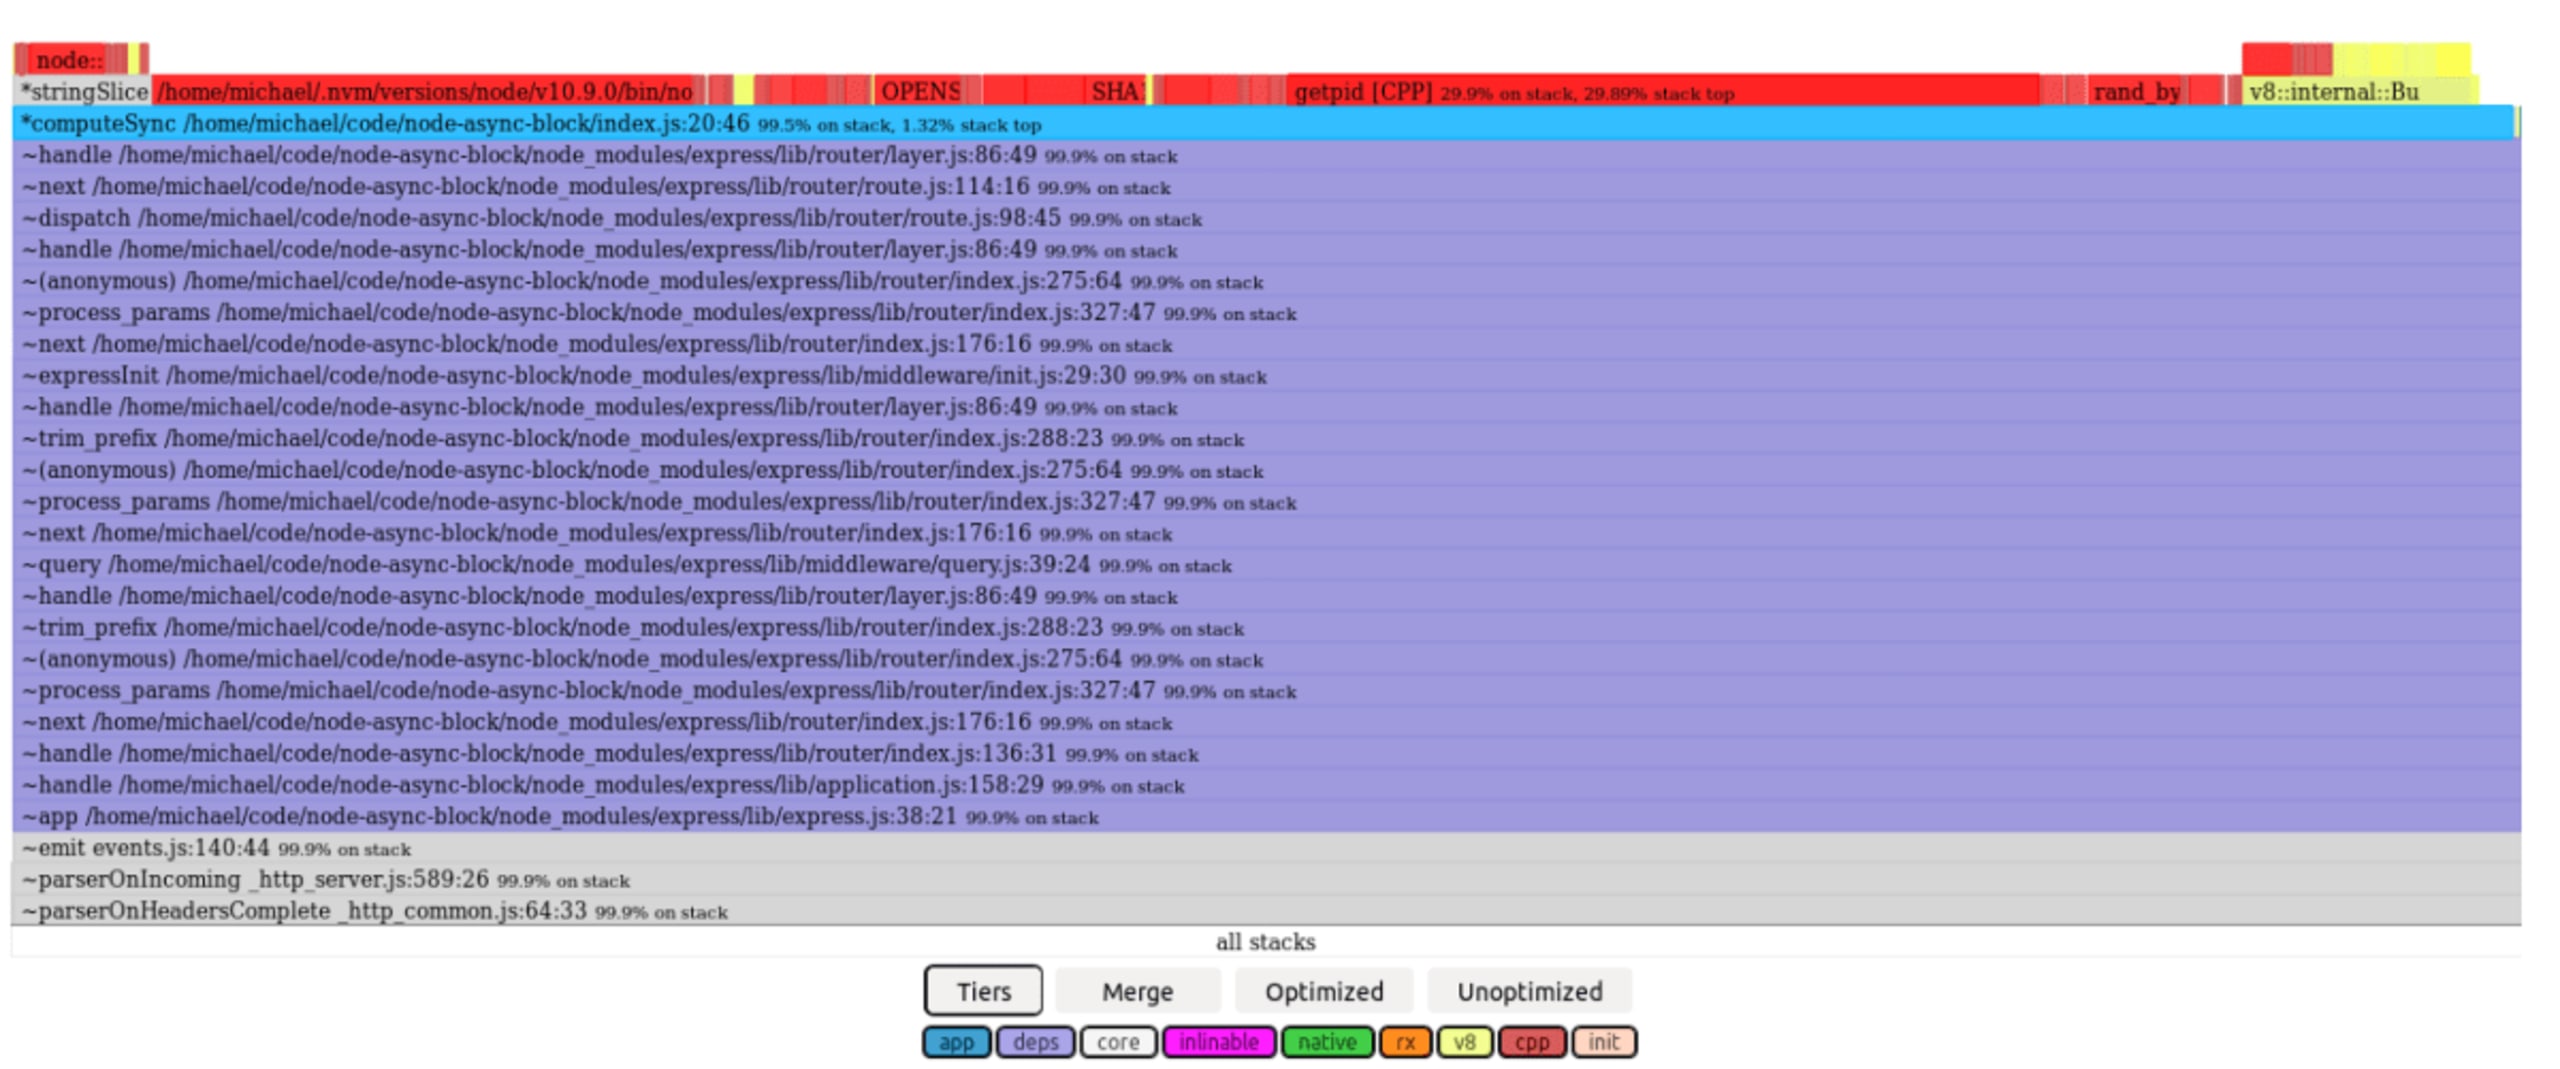
We can see that /compute-sync stack includes the express handler stack, as it was 100% synchronous.
Now, the flame-graph captured while running /compute-async:

The /compute-async flame-graph on the other-hand looks very different, running in the context of V8’s RunMicrotask & AsyncFunctionAwaitResolveClosure functions. So no … doesn’t seem like the async/await was “optimized away”.
Before digging deeper, let’s try one last desperate thing us developers sometimes do: add a sleep call!
Let’s run it:
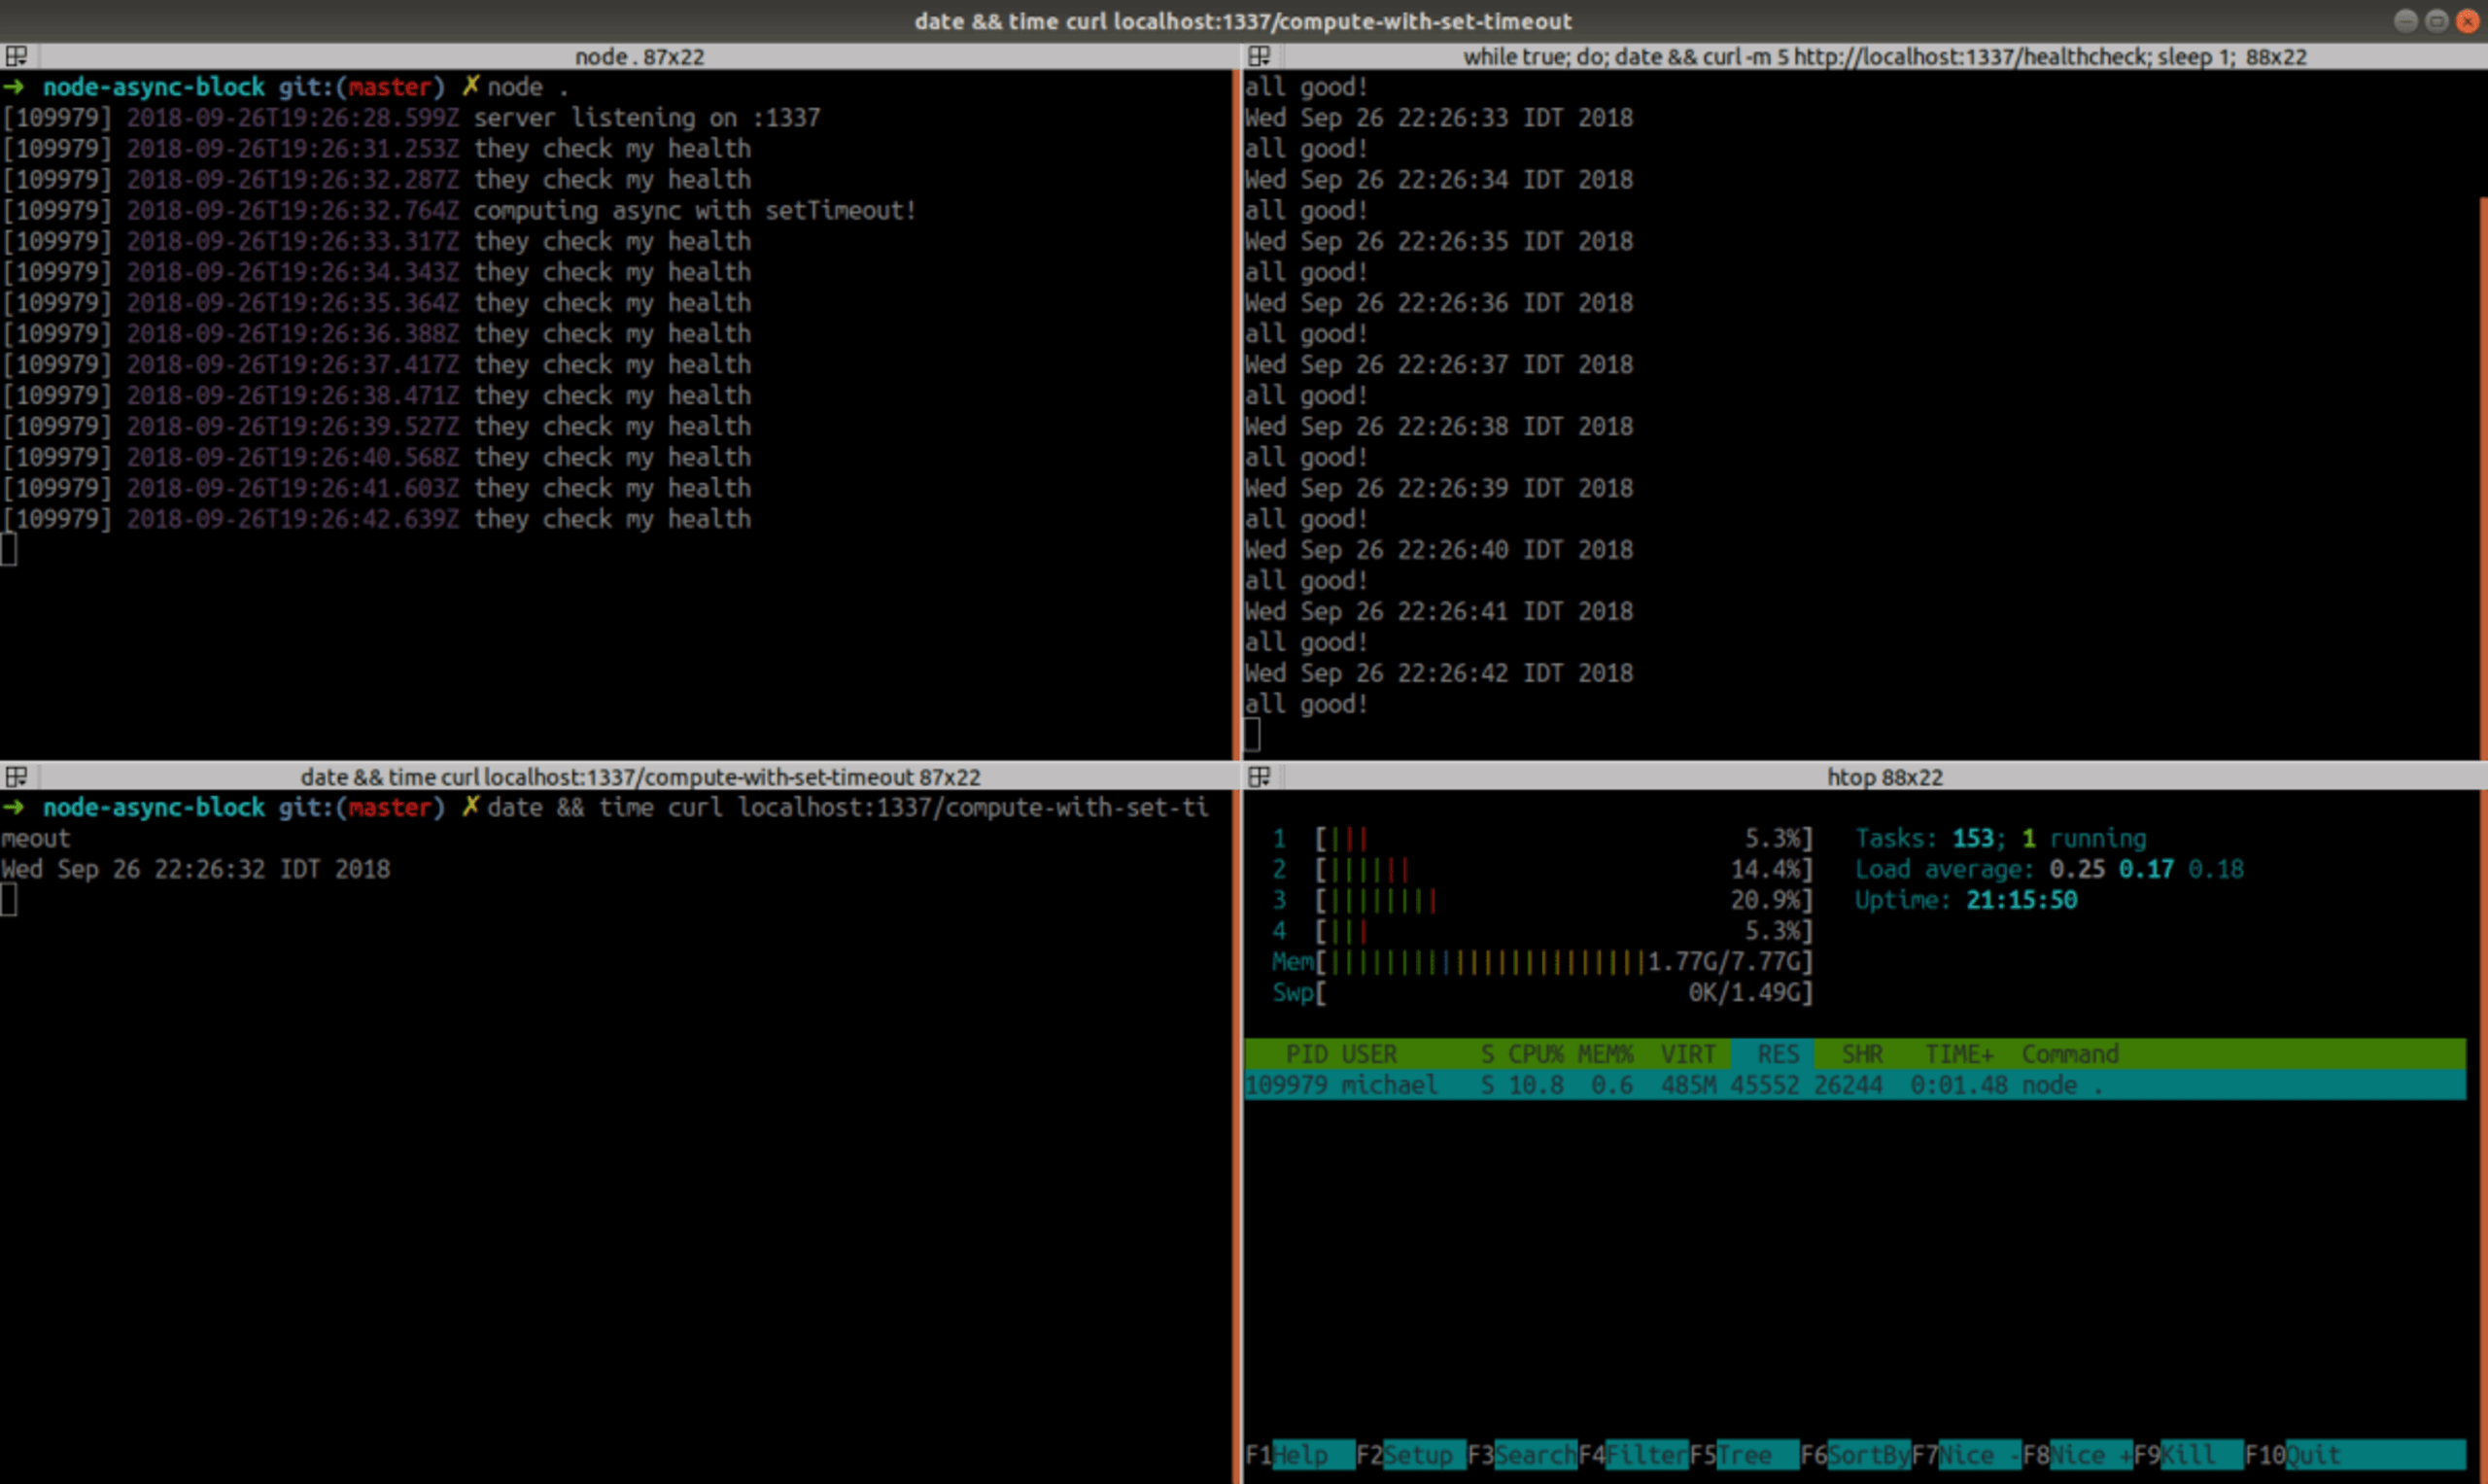
Finally, the server remains responsive during the heavy computation. Unfortunately, the cost of this solution is too high: we can see that the CPU is at about ~10%, so it seems it doesn’t work hard enough on the computation, which practically takes forever to complete (didn’t have enough patience to see it happen). Only by reducing the number of iterations from 10⁷ to 10⁵, it completed after 2:23 minutes! (If you wonder, passing 1, instead of 0, as the delay parameter to setTimeout makes no difference — more on this later)
This raises several questions:
why was the
asynccode blocked without thesetTimeout()call?why did the
setTimeout()add such a massive performance cost?how can we unblock our computation without such a penalty?
Event-Loop Phases
When something similar happened to me, I turned to Google for answers. Looking for stuff like “node async block event loop” one of the first results is this official Node.js. It really opened my eyes.
It explains that the event-loop is not the magic scheduler I imaged it to be, but a pretty straight-forward loop with several phases in it. Here is a nice ASCII diagram of the main phases, copied from the guide:
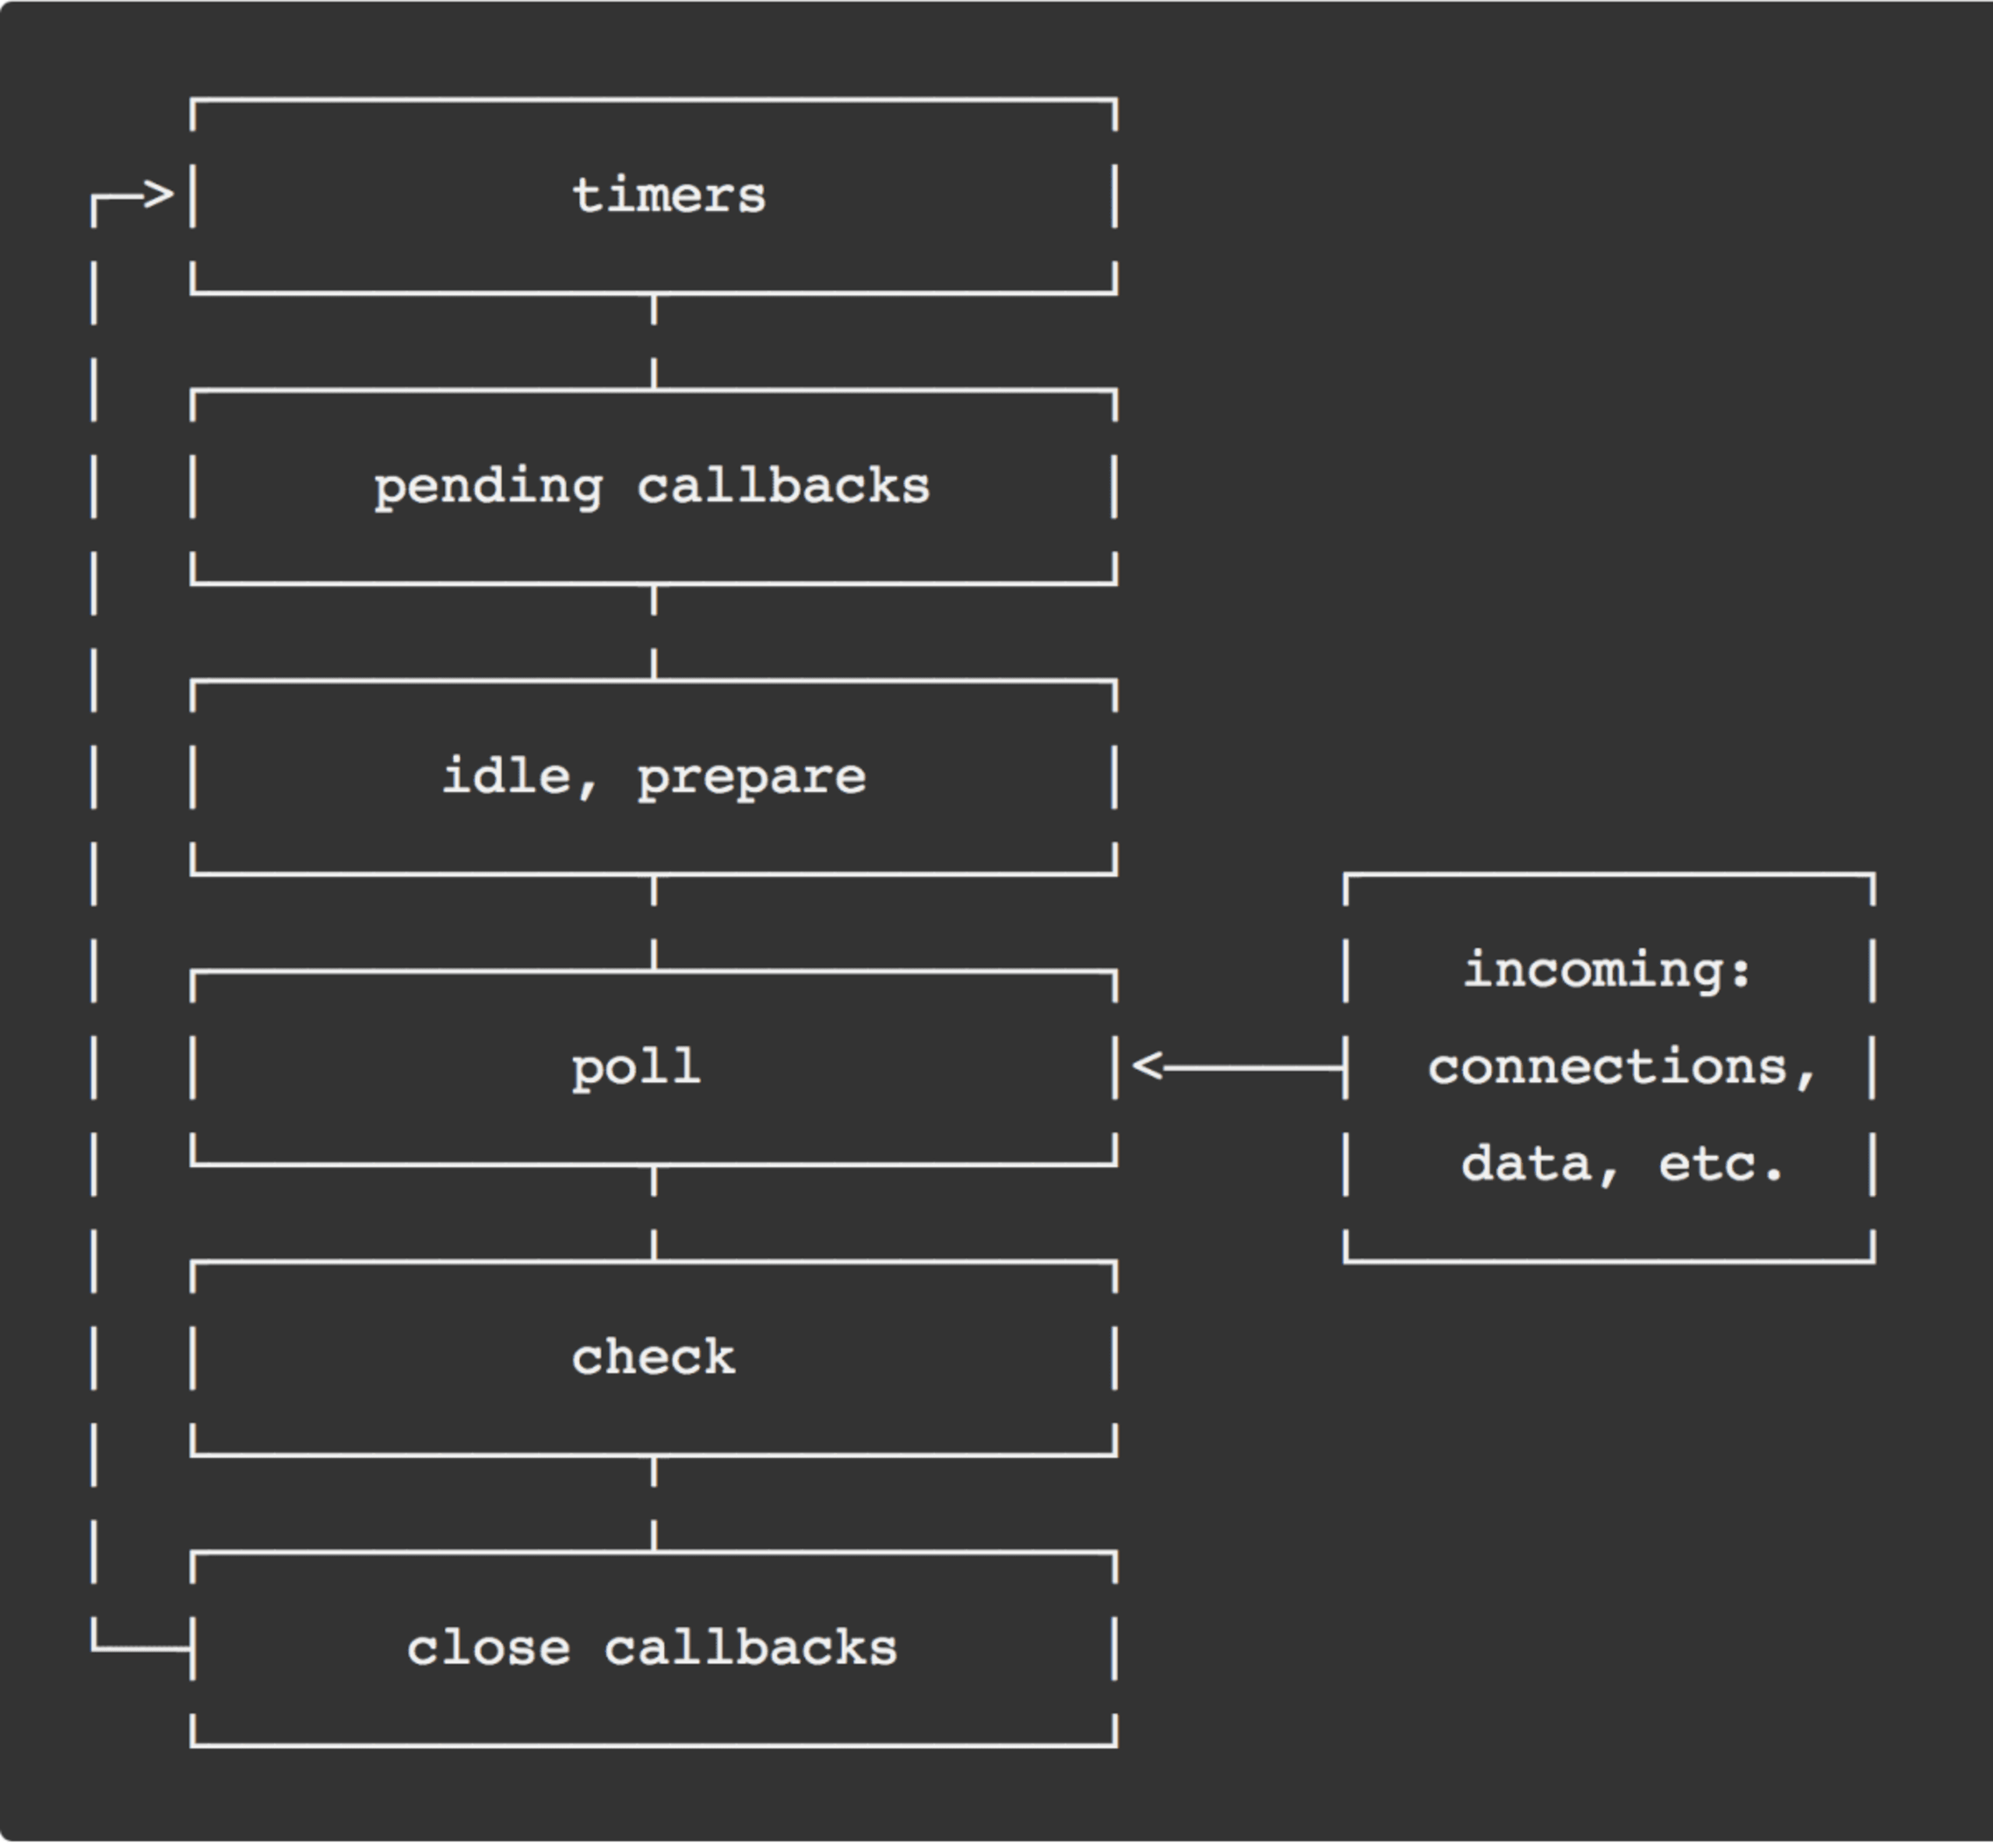
(later I’ve found that this loop is nicely implemented in libuv with functions named as in the diagram: https://github.com/libuv/libuv/blob/v1.22.0/src/unix/core.c#L359)
The guide explains about the different phases, and gives the following overview:
timers: this phase executes callbacks scheduled by
setTimeout()andsetInterval().pending callbacks: executes I/O callbacks deferred to the next loop iteration.
idle, prepare: only used internally.
poll: retrieve new I/O events; execute I/O related callbacks.
check:
setImmediate()callbacks are invoked here.close callbacks: some close callbacks, e.g.
socket.on('close', ...).
What starts to answer our question is this quote:
“generally, when the event loop enters a given phase, it will perform any operations specific to that phase, then execute callbacks in that phase’s queue until the queue has been exhausted … Since any of these operations may schedule more operations …”.
This (vaguely) suggests that when a callback enqueues another callback that can be handled in the same phase, then it will be handled before moving to the next phase.
Only in the poll phase Node.js checks the network socket for new requests. So does that mean that what we did in /compute-async actually prevented the event-loop from leaving a certain phase, and thus never looping through the poll phase to even receive the /healthcheck request?
We’ll need to dig more to get better answers, but it is definitely clear now why setTimeout() helped: Every time we enqueue a timer callback, and the queue of the current phase has been exhausted, the event-loop has to loop through all the phases to reach the “Timers” phase, passing through the poll phase on the way, and handling the pending network requests.
Micro-Tasks
The async/await keywords we used in /compute-async are known to be a syntactic sugar around Promises, so what actually happens there is that in every loop iteration we create a Promise (which is an asynchronous operation) to compute a hash, and when it’s resolved, our loop continues to the next iteration. The mentioned official guide doesn’t explain how Promises are handled in the context of the event-loop phases, but our experiments suggest that both the Promise callback and the resolve callback were invoked without looping through the poll phase.
With some more Google-ing, I’ve found a more detailed and very well written 5-article series about the event loop by Deepal Jayasekara, with information about Promises handling as well!
It contains this useful diagram:
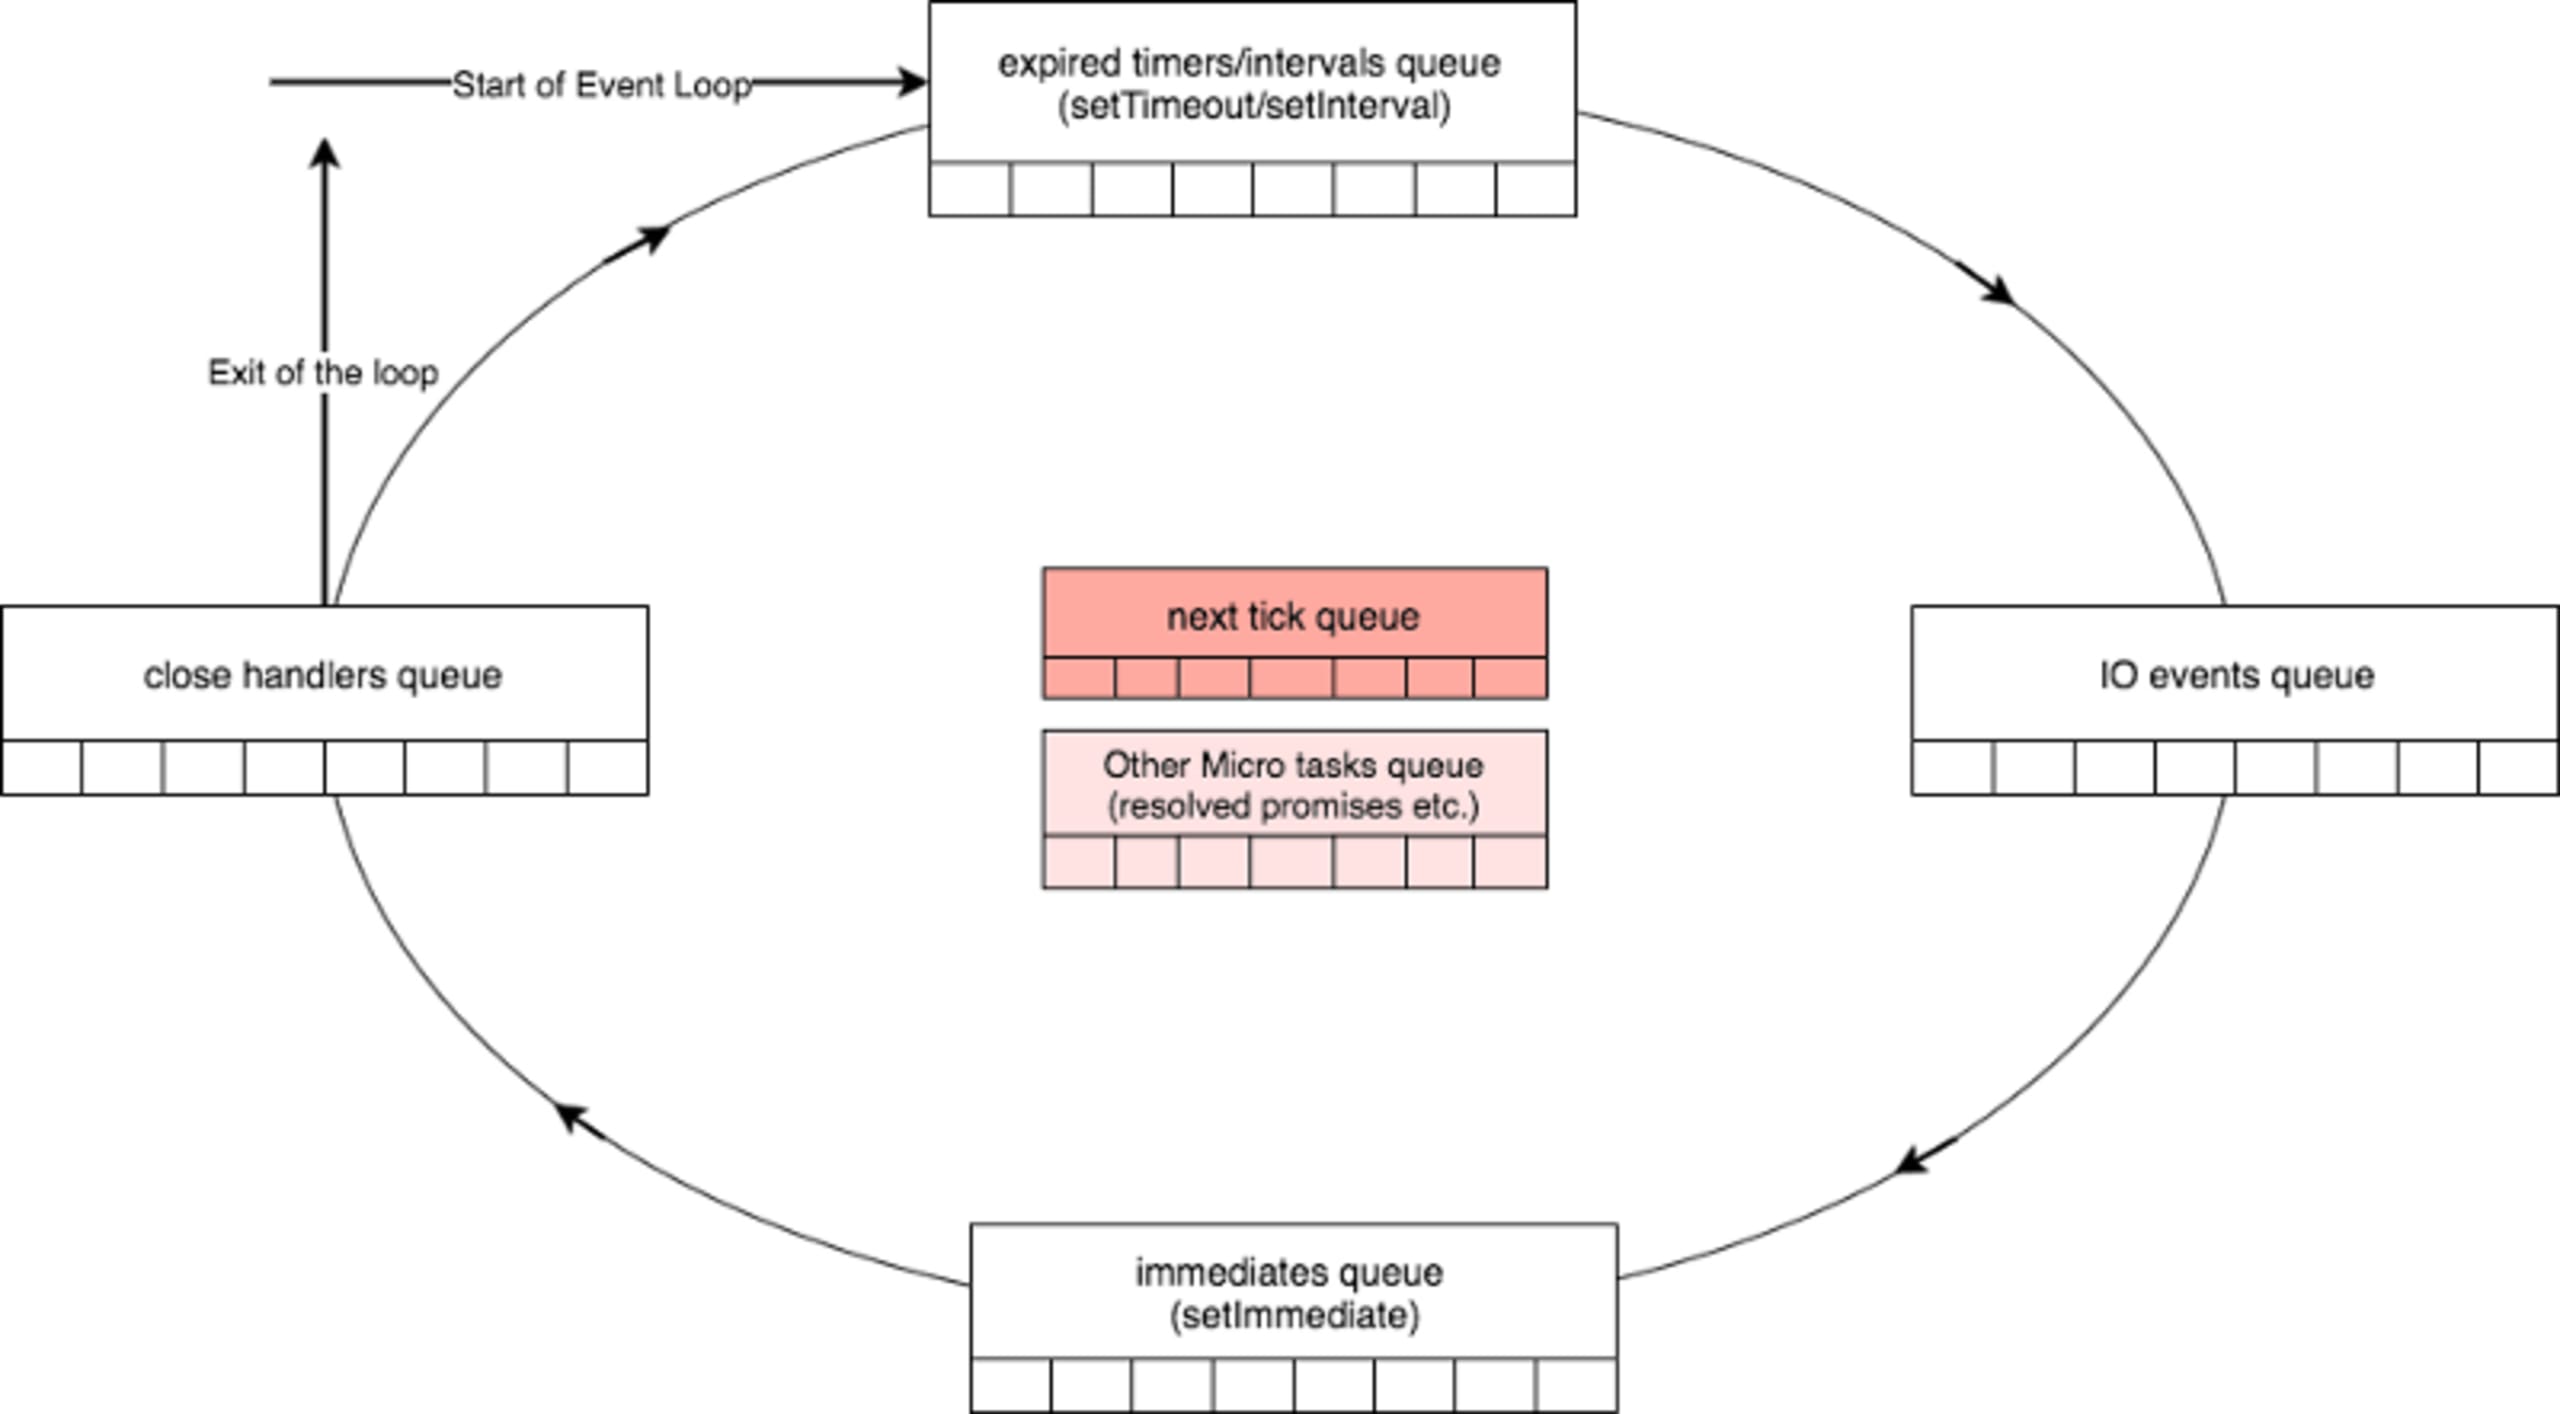
The boxes around the circle illustrate the queues of the different phases we seen before, and the two boxes in the middle illustrate two special queues that need to be exhausted before moving from one phase to the other. The “next tick queue” processes callbacks registered via nextTick(), and the “Other Micro Tasks queue” is the answer to our question about Promises.
And as in our case, if a resolved Promise creates another Promise, will it be handled in the same phase before moving to the next one? The answer, as we saw, is yes! How this happens can be seen in V8’s source. This link points to the implementation of RunMicrotask() . Here is a snippet of the implementation with the relevant lines:
This C code looks weird and does loops via magic & low-level Goto() and Branch() functions/macros, because it’s written using V8’s “CodeStubAssembly” which is a “a custom, platform-agnostic assembler that provides low-level primitives as a thin abstraction over assembly”.
We can see in the gist that there is an outer loop labeled init_queue_loop and an inner one labeled loop. The outer loop checks the actual number of pending micro-tasks, then the inner loop handles all the tasks one by one, and once done, as seen on line 62 in the gist above, it iterates the outer loop, which checks again the actual number of pending micro-tasks, and only if nothing new was added the function returns.
If you want to see how the handling of micro-tasks happens at the end of every event-loop phase, I recommend you follow another great article by Deepal Jayasekara.
(b.t.w, remember the flame-graph we created for /compute-async? If you’ll scroll up to look again, you will recognize the RunMicrotasks() in the stack)
Also note, that Micro-Tasks is a V8 thing, so it’s relevant to Chrome as-well, where Promises are handled the same way — without spinning the browser event-loop.
nextTick() won’t tick
The Node.js guide says:
callbacks passed to
process.nextTick()will be resolved before the event loop continues. This can create some bad situations because it allows you to “starve” your I/O by making recursiveprocess.nextTick()calls
This time it’s pretty clear from the text so I’ll spare you another terminal screenshot, but you can play with it by doing GET /compute-with-next-tick in the node async block.
The nextTick queue is processed here.
It’s clear that if callback calls another process.nextTick(), the loop will process the next callback in the same loop, and break only once the nextTick queue is empty.
setImmediate() to the rescue?
So, Promises are red, Timers are blue — what else can we do?
Looking at the diagrams above, both mention the setImmediate() queue that is processed during the “check” phase, right after the “poll” phase. The official Node.js guide also says:
setImmediate()andsetTimeout()are similar, but behave in different ways depending on when they are called …
The main advantage to using
setImmediate()oversetTimeout()issetImmediate()will always be executed before any timers if scheduled within an I/O cycle, independently of how many timers are present.
Sounds good, but the most promising quote from there is:
If the poll phase becomes idle and scripts have been queued with
setImmediate(), the event loop may continue to the check phase rather than waiting.
Do you remember that when we used setTimeout(), the process was mostly idle (i.e. waiting), using ~10% CPU? let’s see if setImmediate() will solve this:
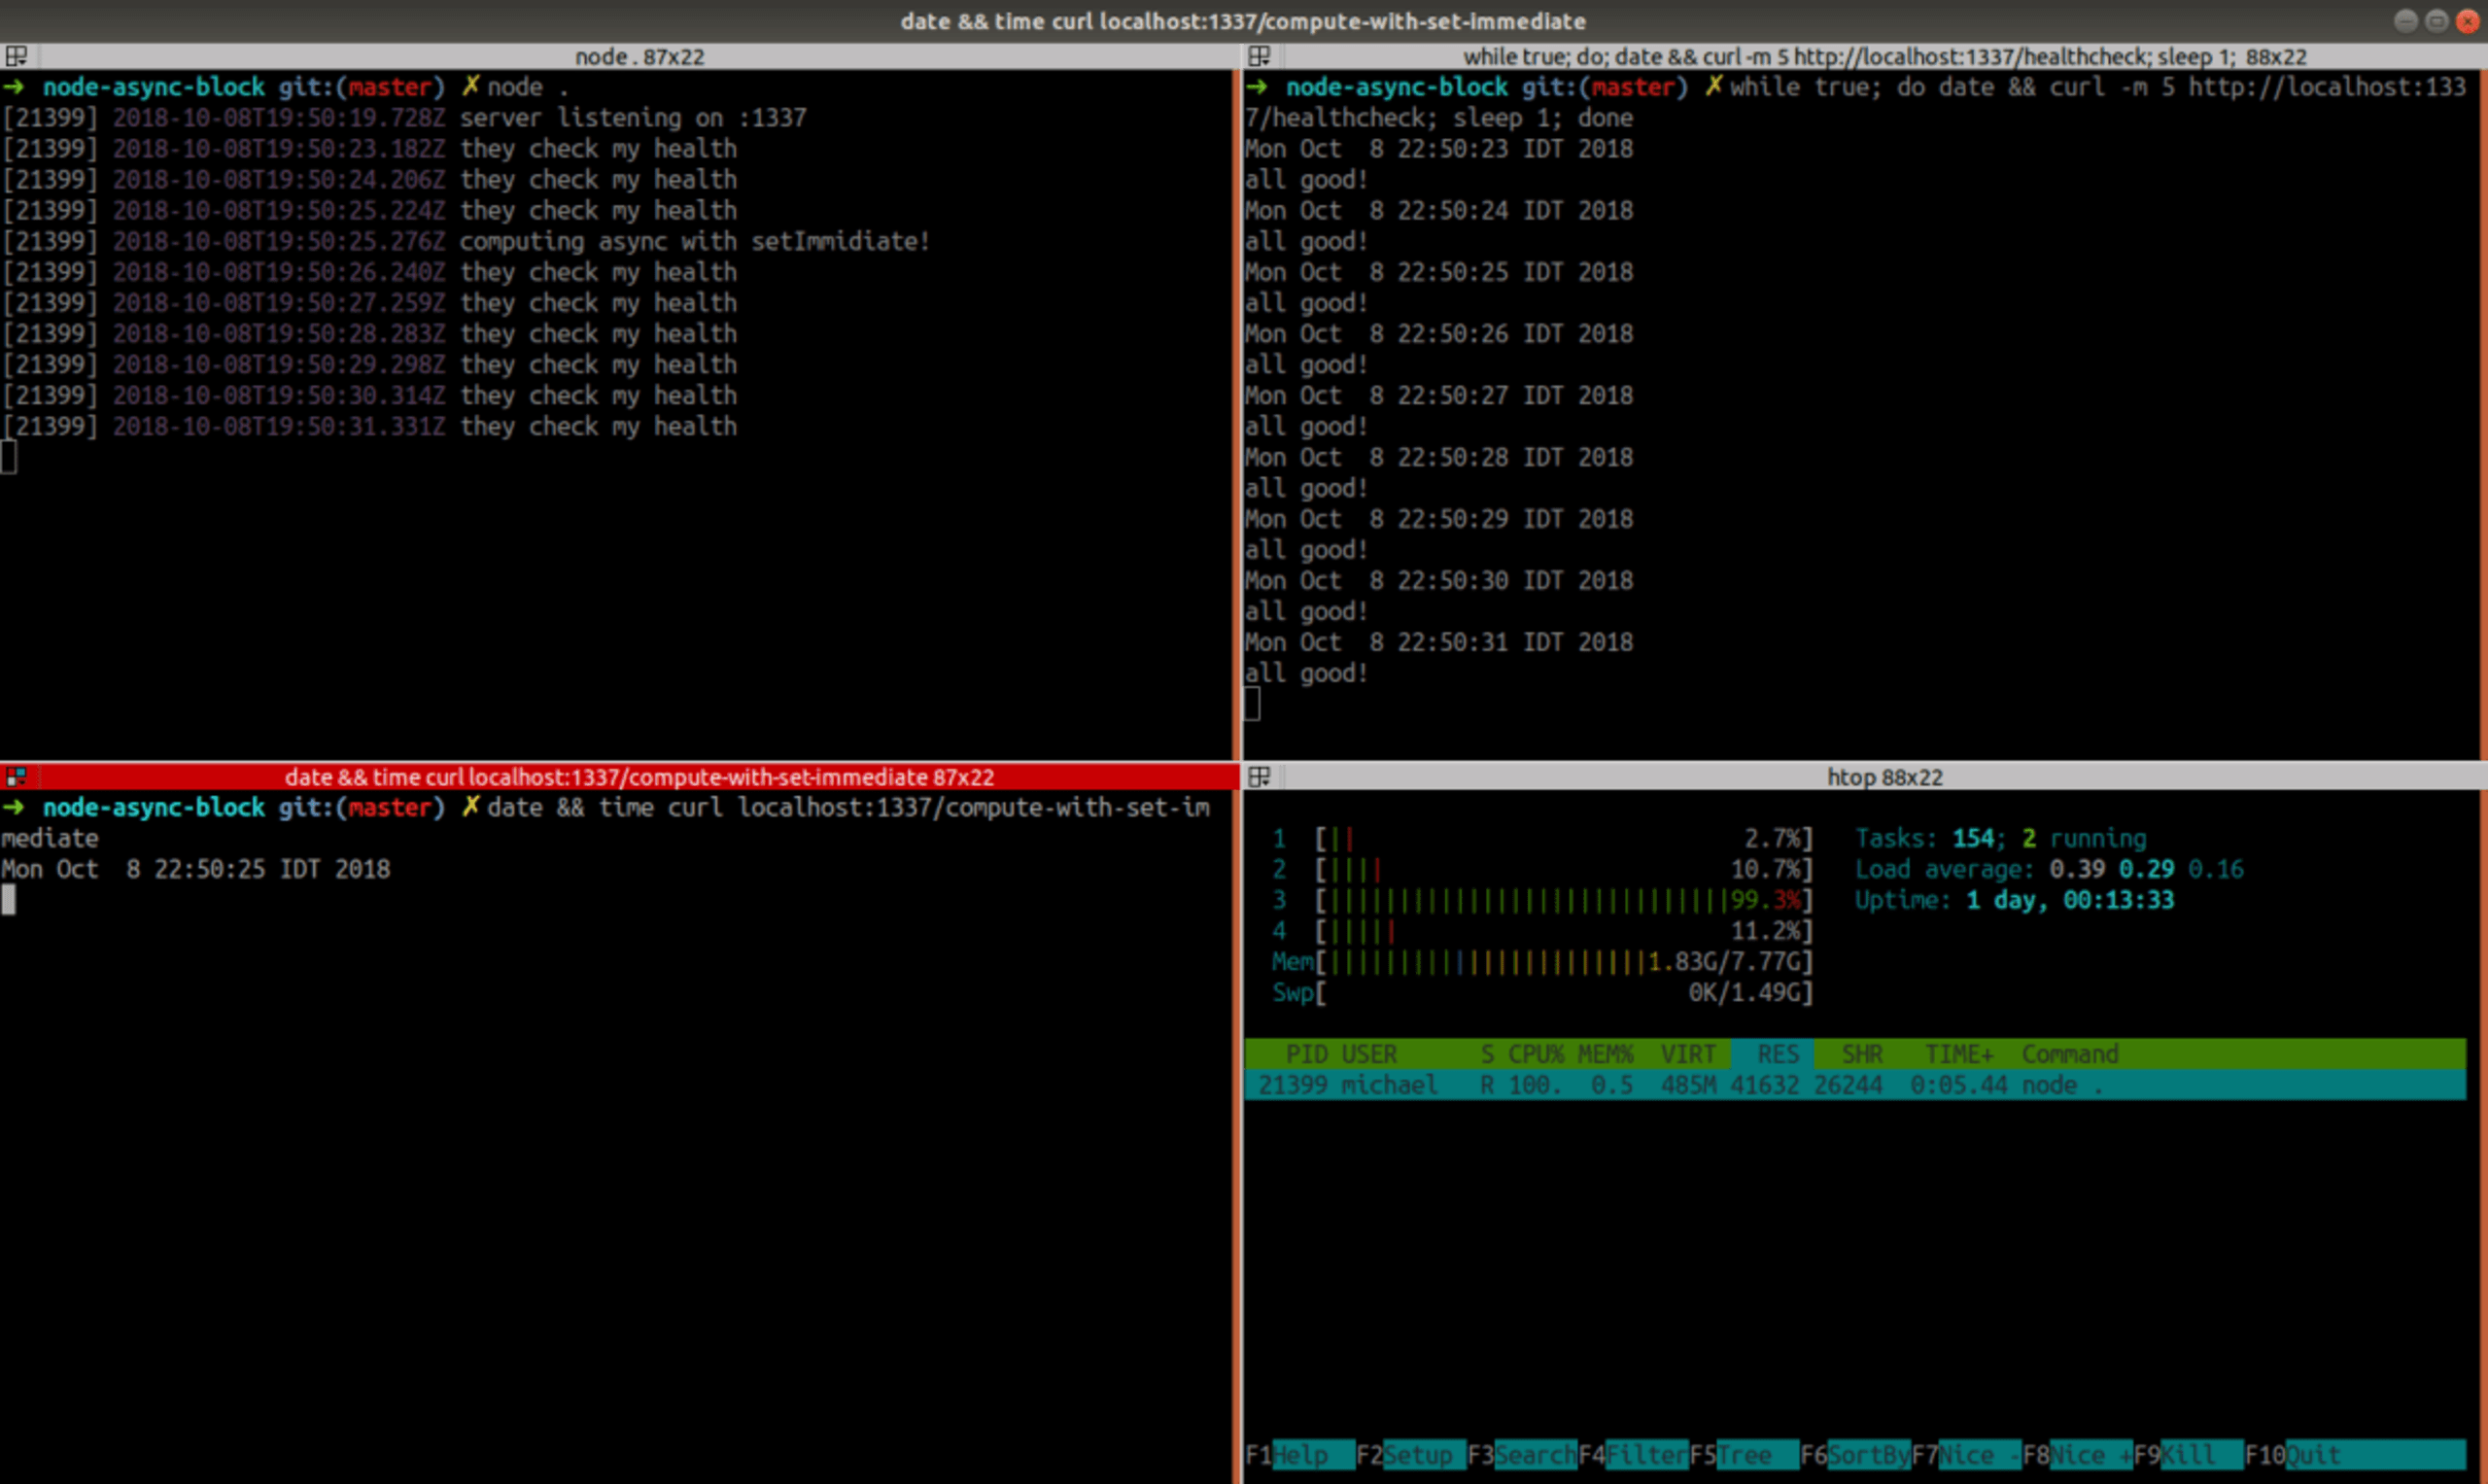
Yay! It doesn’t block the server and the CPU is at 100%! Let’s see how much time it takes to complete:
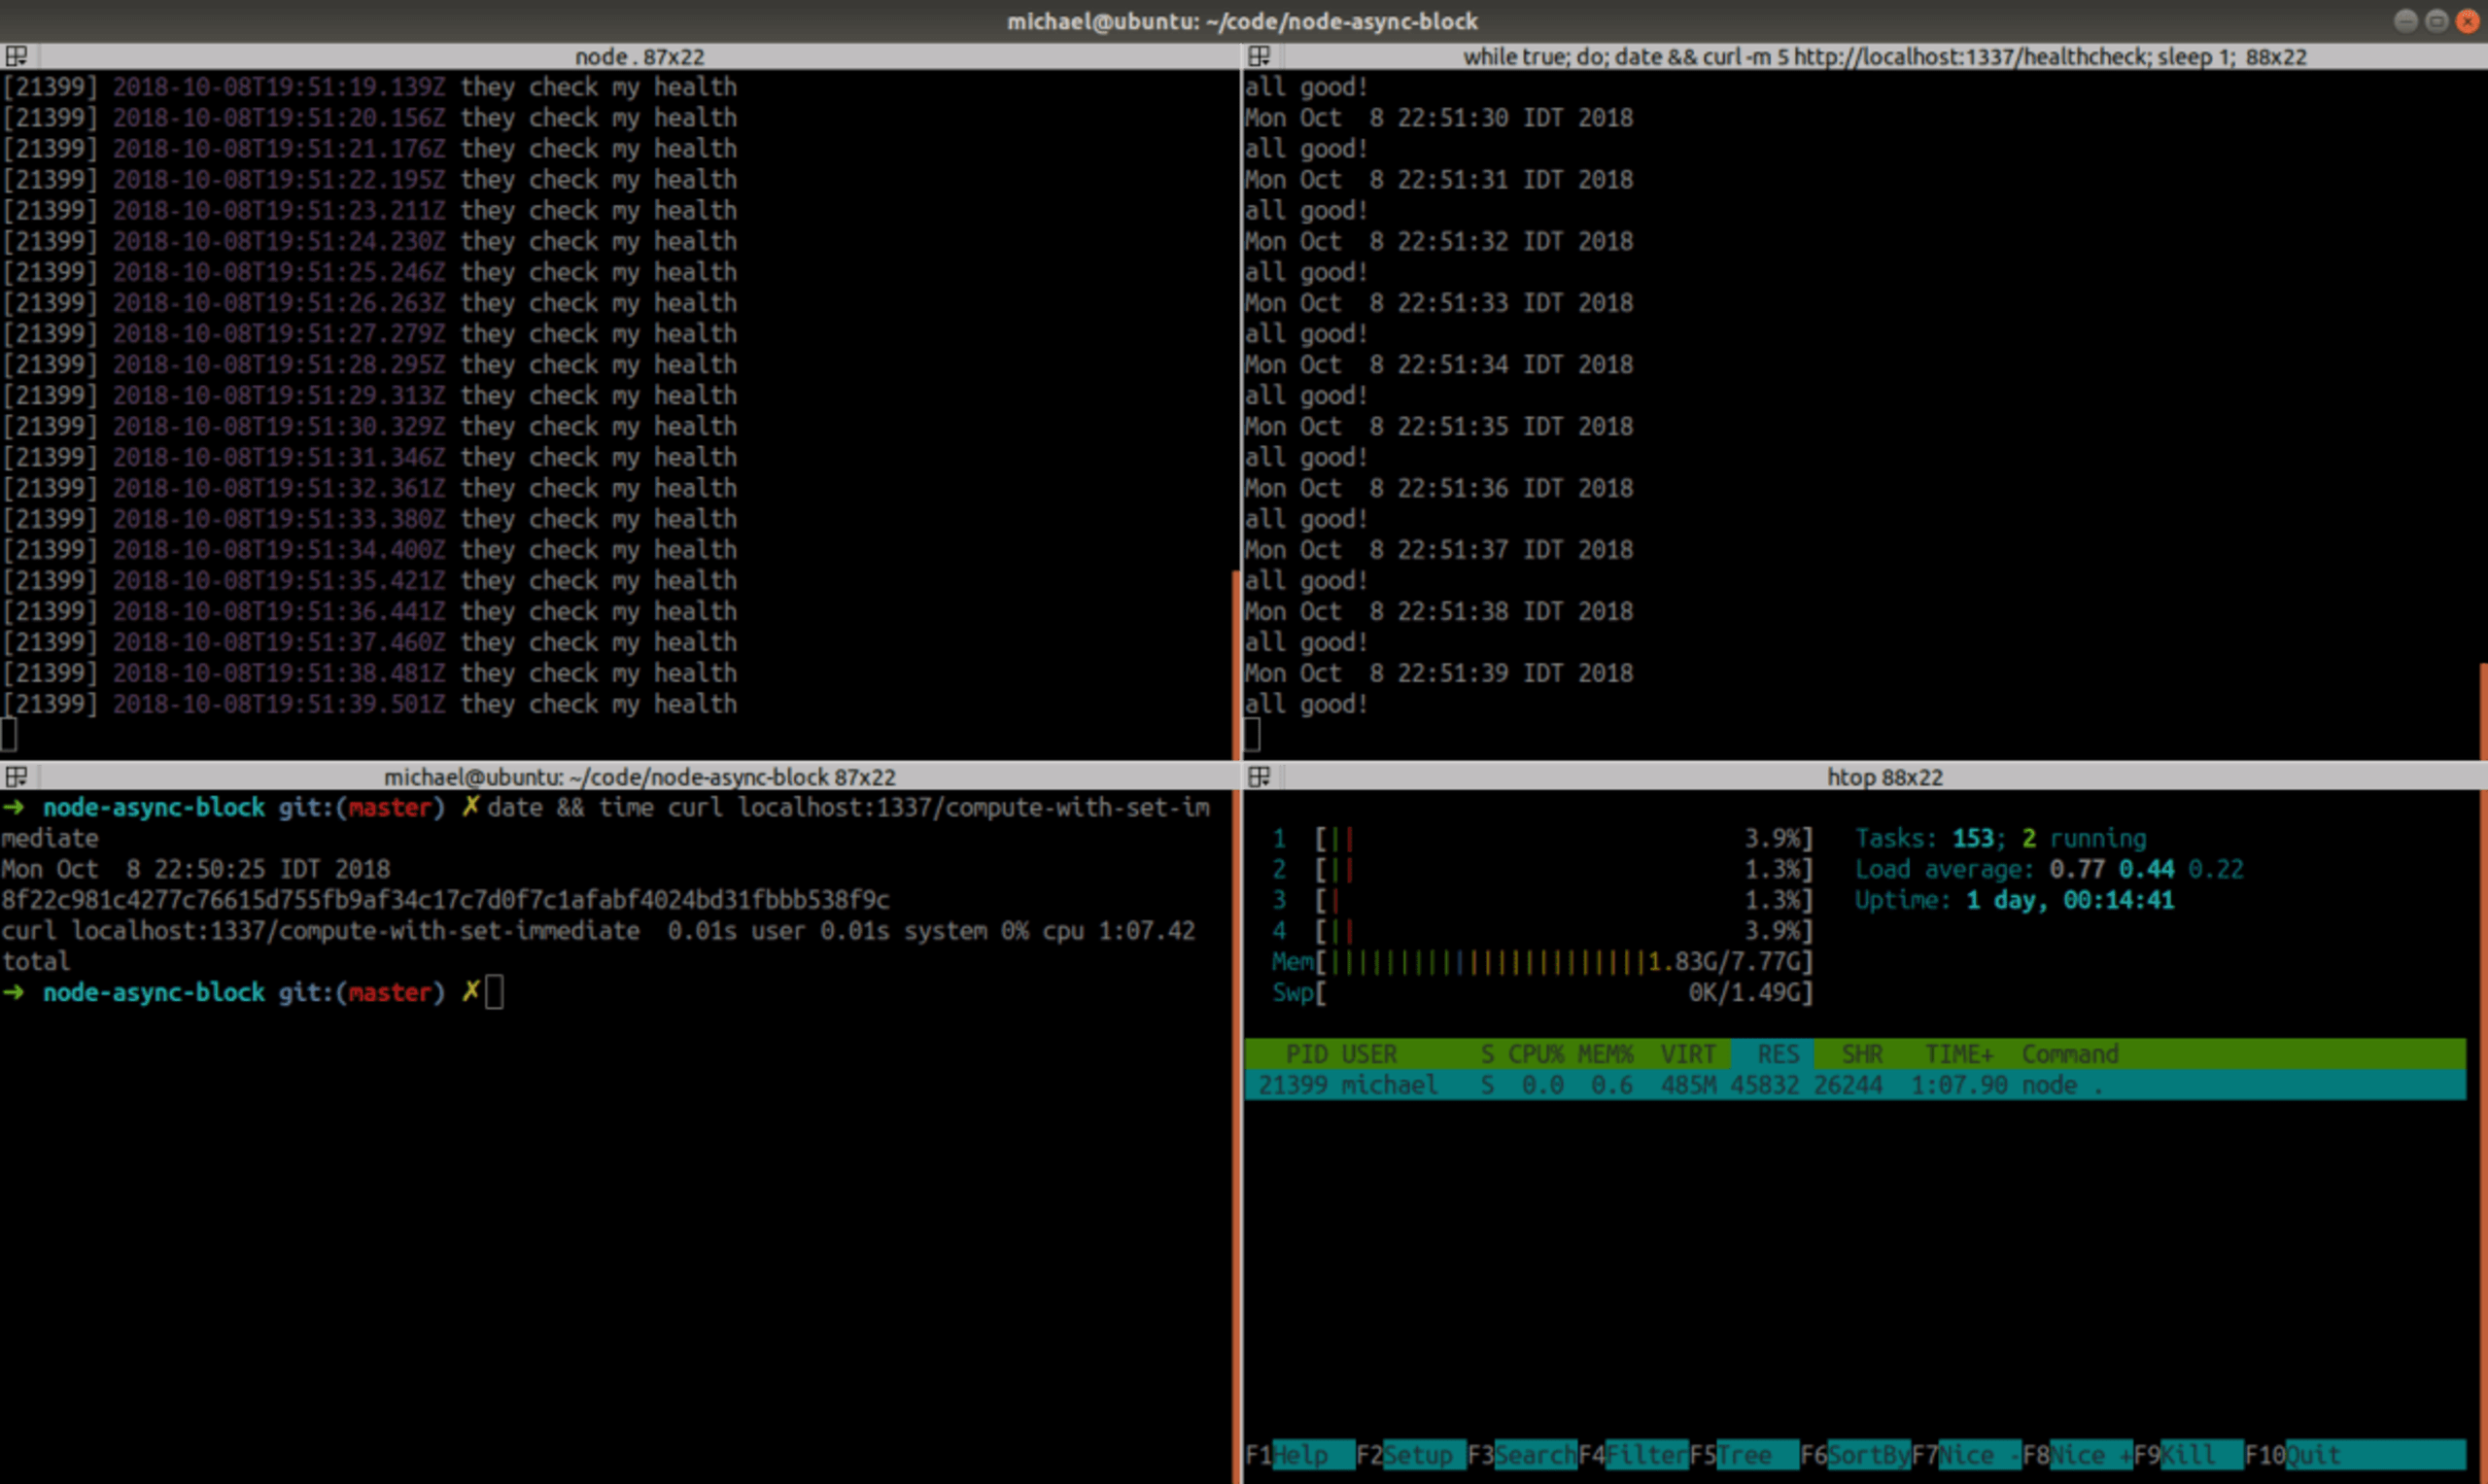
Well, nice. it completed in 1:07 minutes, about 50% longer then /compute-sync and 34% longer than /compute-async — but it’s usable, unlike /compute-with-set-timeout. Given the fact it’s a toy example, where we used setImmediate() in every one of the 10⁷ tiny iterations, which probably resulted in 10⁷ full event-loop spins, this slowdown is quite understandable. So scheduling a setImmediate() from a setImmediate() callback doesn’t cause it to remain in the same phase? Yep, the Node.js documentation clearly says:
If an immediate timer is queued from inside an executing callback, that timer will not be triggered until the next event loop iteration
When comparing setImmediate() to process.nextTick(), the Node.js guide says:
We recommend developers use
setImmediate()in all cases…
You’ve been spoiled already with code references, so to not disappoint, I believe this is the actual code that executes the setImmediate() callbacks — b.t.w: a nice fact mentioned in Part 3 of Deepal’s series, is that the Bluebird, a popular non-native-Promise library uses setImmediate() to schedule Promise callbacks.
Closing thoughts
(Almost, as a bonus section about setTimeout() follows) So, setImmediate() seems to be a working solution for partitioning long-running synchronous code. But it’s not always easy to do and do right. There is obviously an overhead in each yield to setImmediate() , and the more requests are pending, the longer it will take to the long-running task to complete — so partitioning your code too much is problematic, and doing it too little can block for too long. In some cases the blocking code is not a simple loop like in our example, but rather a recursion that traverses a complex structure and it becomes more tricky to find the right place and condition to yield. A possible idea for some cases it to keep track of how much time is spent blocking before yielding to setImmediate(). This snippet will yield only if at-least 10ms passed since last yielding:
In other cases a 3rd-party code you have less control over might block — even builtin functions like JSON.parse() can block.
A more extreme solution is to offload potentially blocking code to a different (non Node.js) service, or to sub-processes (via packages like tiny-worker) or actual threads via packages like webworker-threads or the (still experimental) Node.js worker-threads built-in. In many cases, this is the right solution, but all these offloading solutions come also with the hurdle of passing serialized data back and forth as the offloaded code can’t access the context of the main (and only) JS thread.
A common challenge with all these solutions is that the responsibility to avoid blocking is in the hands of every developer, rather than being the responsibility of the OS, like in most threaded languages or the responsibility of the run-time VM, like in Erlang. Not only it’s hard to make sure all developers are always aware of this, many times it’s also not optimal to yield explicitly via the code, which lacks the context and visibility of what happens with other pending routines and IO.
The high-throughput that Node.js enables, if used not carefully, can cause many pending requests waiting in-line due to a single blocking operation. To signal the load-balancer as quickly as possible that a server has a long list of lagging requests, and make it route requests to different nodes, you can try using packages such as toobusy-js in your health-check endpoints (this won’t help during the actual blocking…). It’s also important to monitor the event-loop in run-time via packages like blocked-at or solutions like N|Solid and New-Relic.
Bonus: Why the 0 in setTimeout(0) is not really 0
I was really curious why setTimeout(0) had made the process 90% idle instead of crunching our computation. Idle CPU probably means that node‘s main thread invoked a system-call that caused it to suspend it’s execution (i.e. sleep) for long enough before being scheduled by the kernel to continue, which hints at our setTimeout().
Reading libuv‘s source around handling of timers, it seems that the actual “sleep” happens in uv__io_poll(), as part of poll() syscall via it’s timeout parameter.
poll()‘s man-page says:
The
timeoutargument specifies the number of milliseconds that poll() should block waiting for a file descriptor to become ready… specifying a negative valueintimeoutmeans an infinite timeout. specifying atimeoutof zero causes poll() to return immediately.
So, unless the timeout is exactly 0, the process will sleep. We suspect that despite passing 0 to setTimeout() the actual timeout passed to poll() is higher. We can try to validate that by debugging node itself via gdb.
We can trace all calls to uv__io_poll() by using gdb‘s dprintf command:
let’s also print the current time every trace:
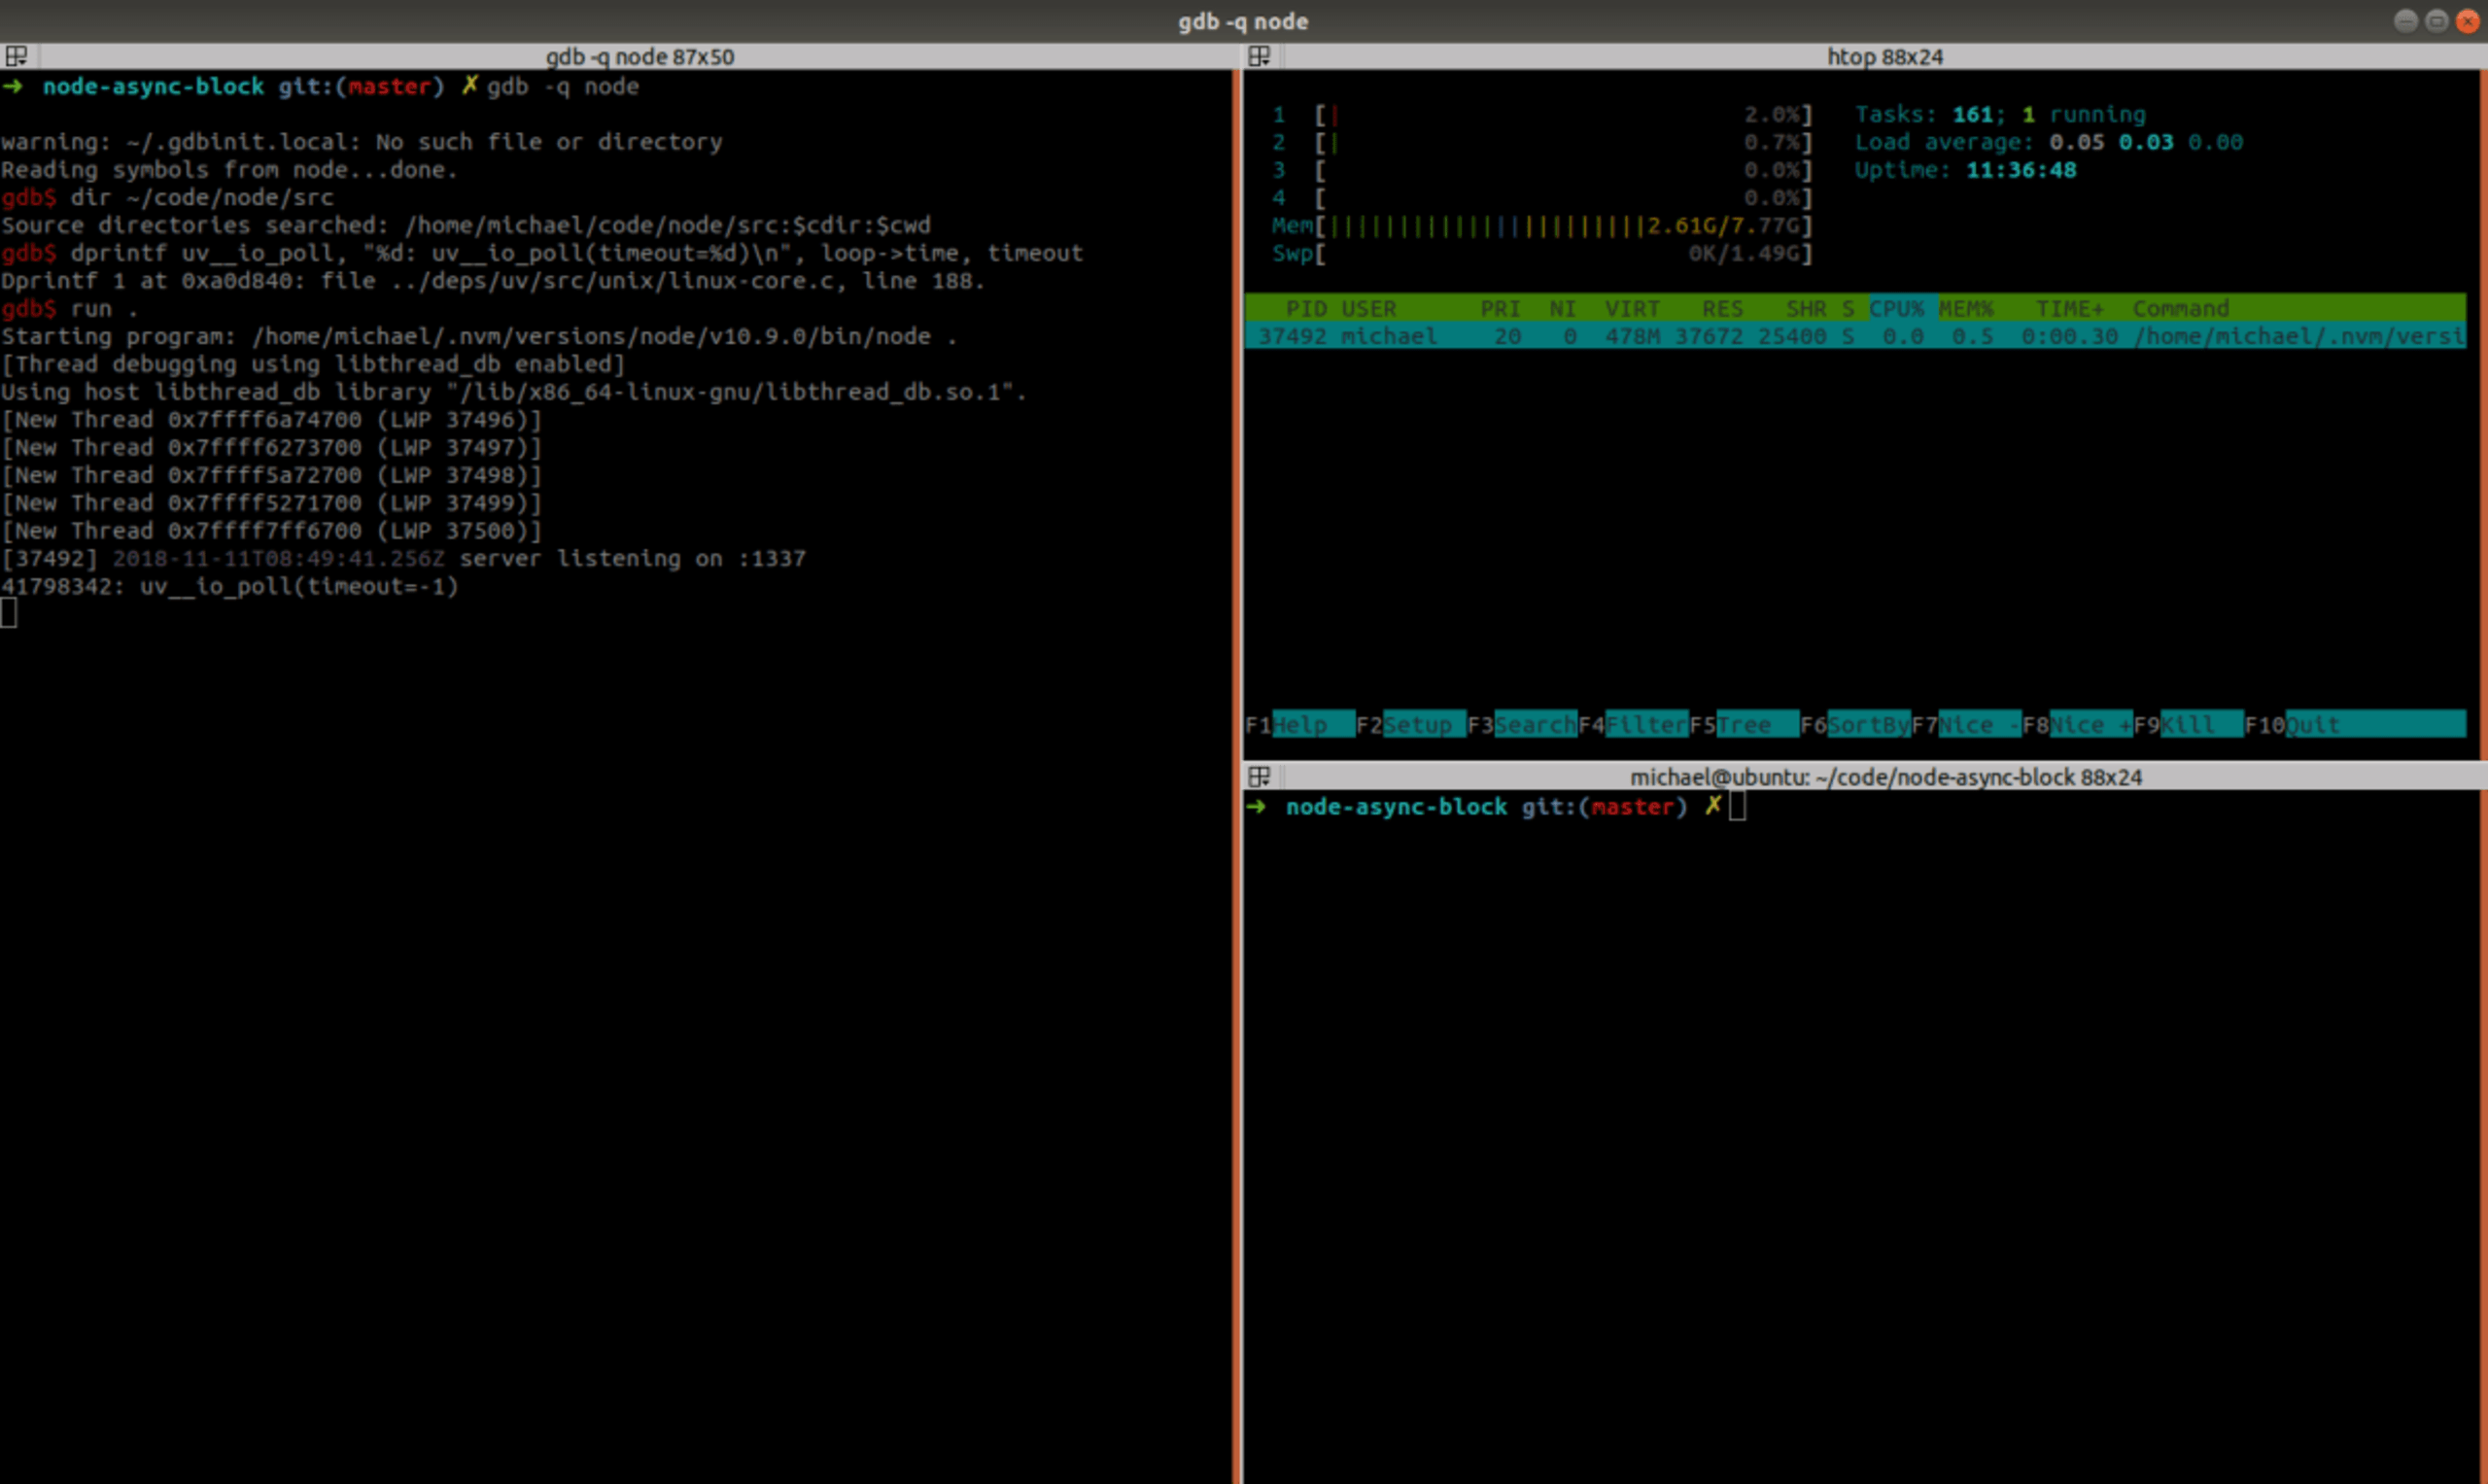
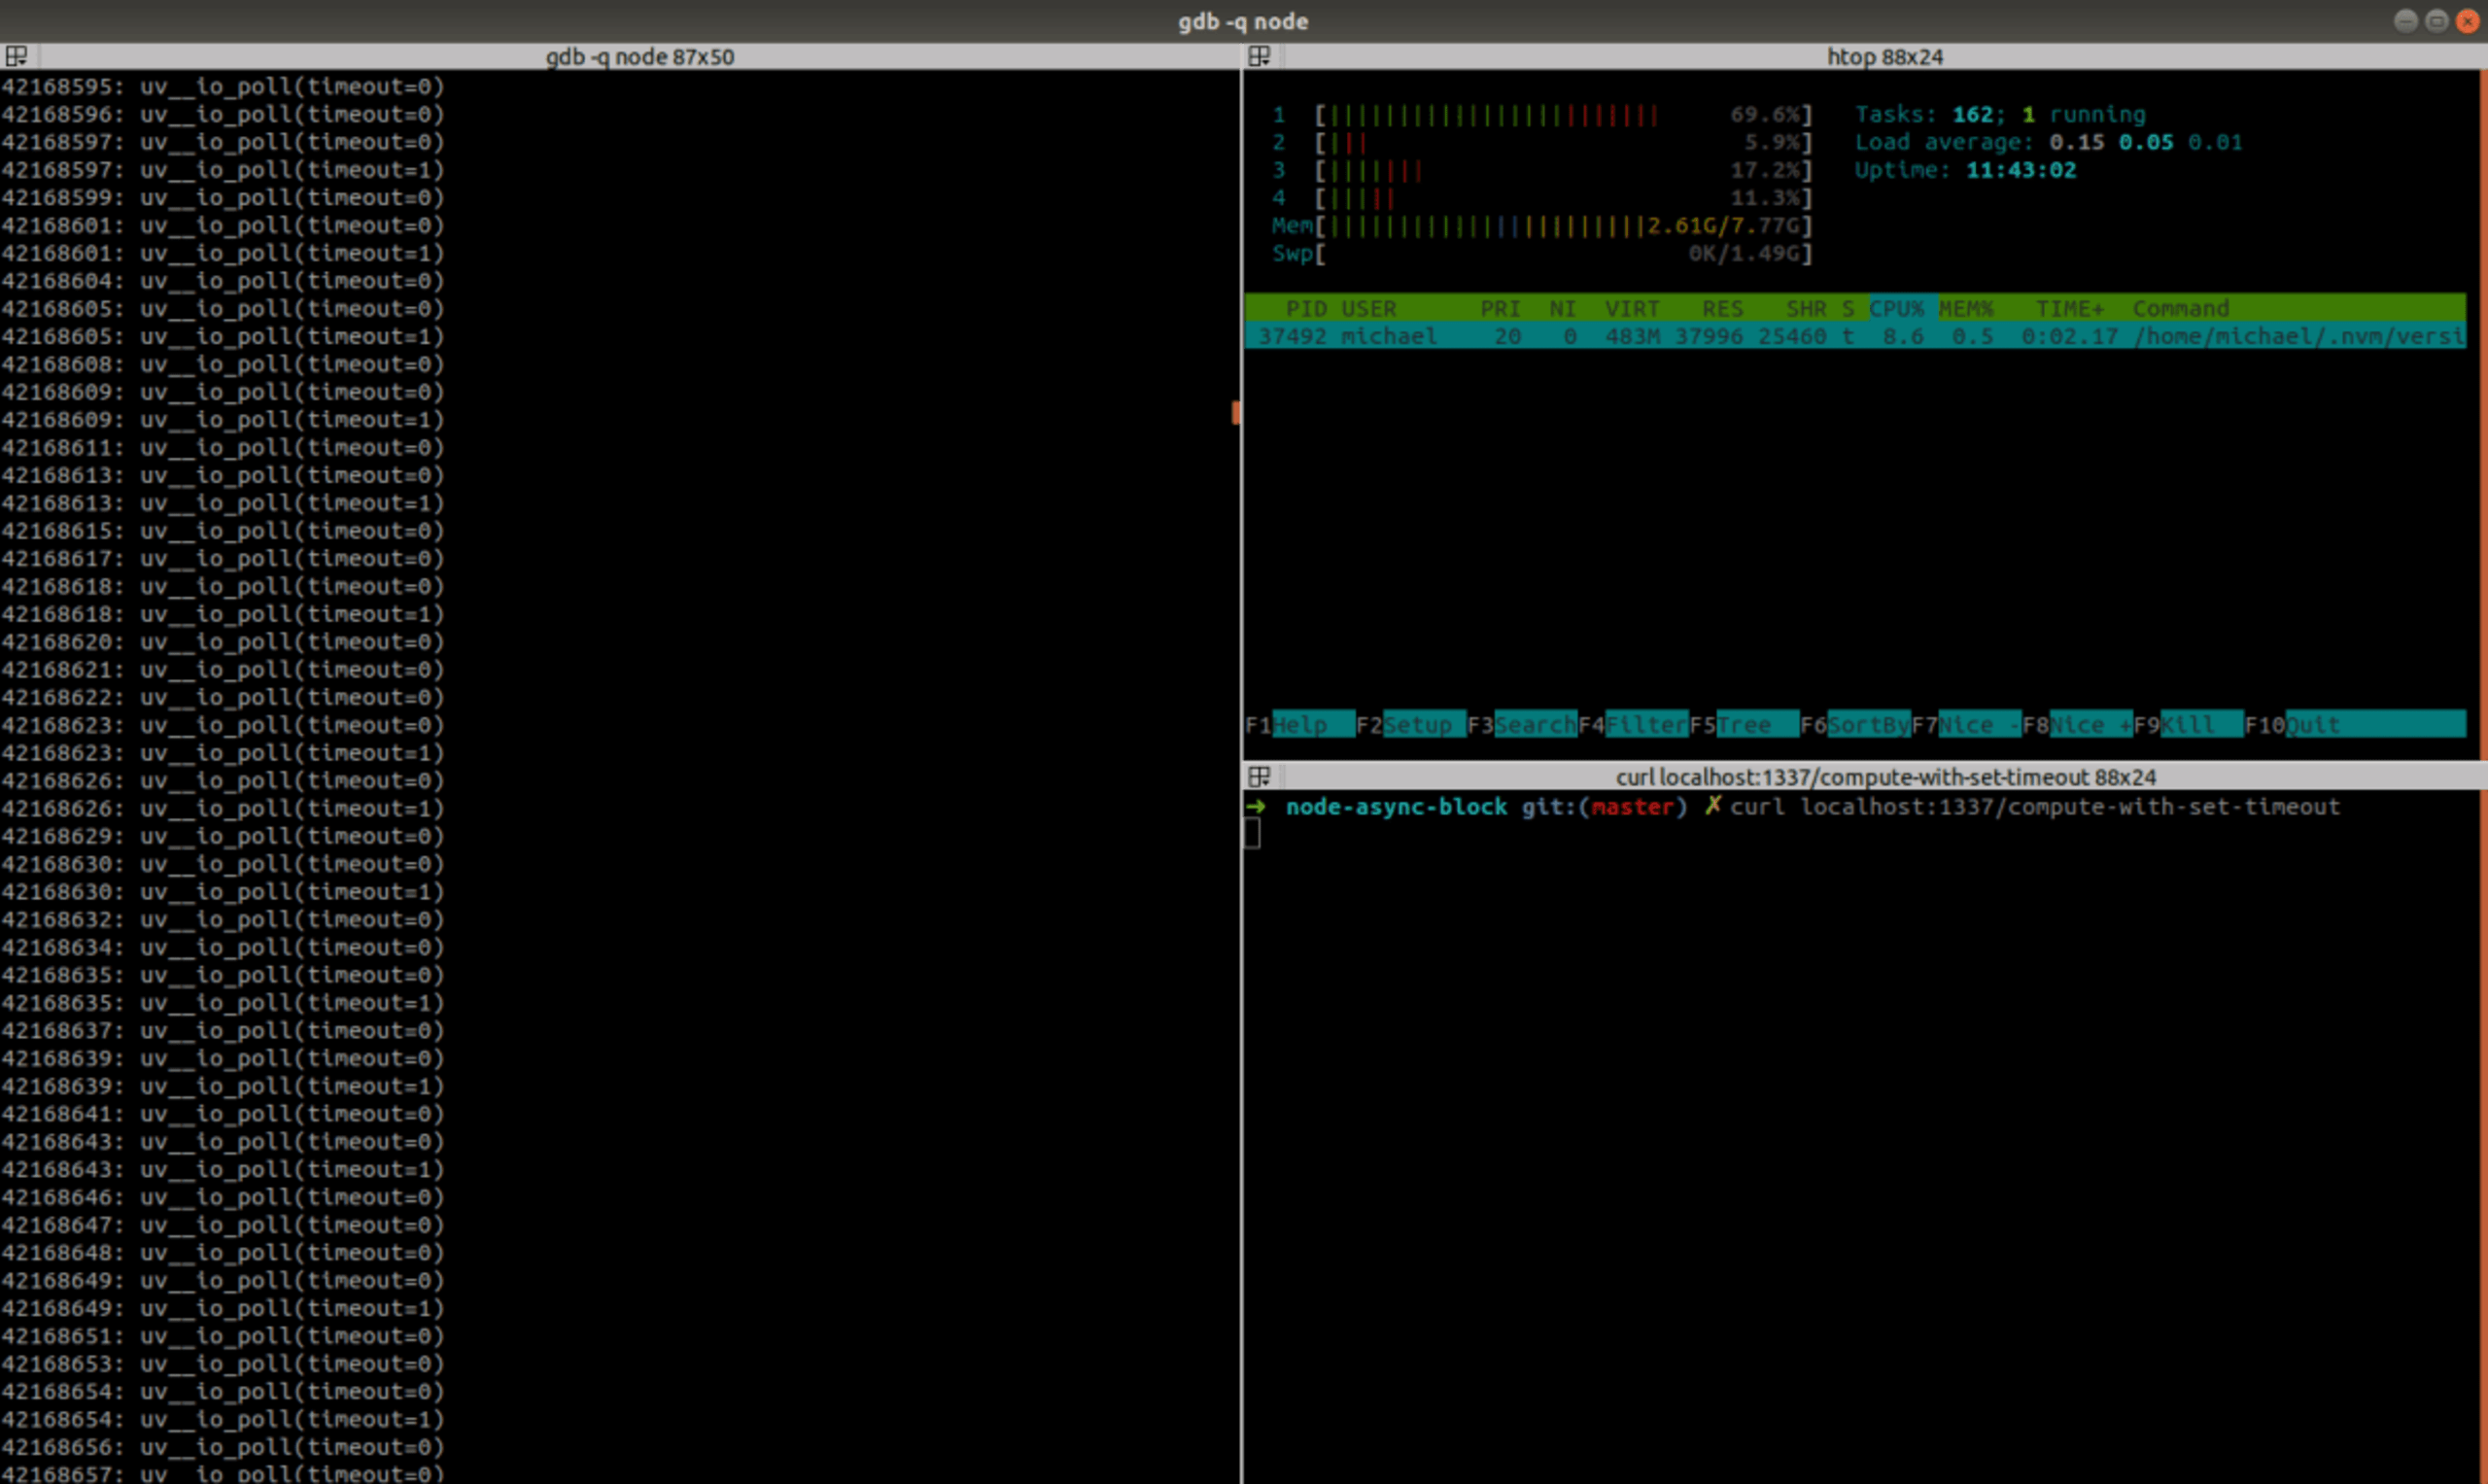
When our server starts, uv__io_poll() is called with a timeout of -1, which means “infinite timeout” — as it has nothing to do except waiting for an HTTP request. Now let’s GET the /compute-with-set-timeout endpoint:
As we can see, the timeout is sometimes 1, and also when it’s 0, usually at-least 1 ms passes between two consecutive calls. Debugging the same way while GET-ing /compute-with-set-immediate will always show timeout=0.

For a CPU, 1 millisecond is quite a long time. The tight loop at /compute-sync completed 10⁷ iterations in 43 seconds, which means it did ~233 random hash computations every millisecond. Waiting for 1ms on every iteration means waiting 10,000 seconds = 2:45 hours!
Lets’s try to understand why the timeout that is passed to uv__io_poll() isn’t 0. The timeout is computed in uv_backend_timeout() an then passed to uv__io_poll() as can be seen in the main libuv loop. For some cases (such as pending active handles or requests) uv_backend_timeout() returns 0, otherwise it returns the result of uv__next_timeout() which picks the nearest timeout from the “timer heap” and returns the remaining time to it’s expiry.
The function that is used to add the “timeouts” to the “timer heap” is uv_timer_start(). This function is called in many places, so we can try to set a breakpoint on it to better locate the caller that passes a non-zero value in our case. Running the info stack command in GDB at the breakpoint gives:
TimerWrap::Start is just a thin wrapper around uv_timer_start() and the unrecognizable addresses up the stack indicate that the actual code we look for is probably implemented in JavaScript. By either looking for uses of TimerWrap:Start in Node’s source or by simply “stepping into” the implementation of setTimeout() from the JS side via a JS debugger, we can quickly locate the Timeout constructor at https://github.com/nodejs/node/blob/v10.9.0/lib/internal/timers.js#L53:
Finally, here we see that a timeout of 0 is coalesced to 1.
Hope you found this article useful. Thanks for reading.
References:
https://nodejs.org/en/docs/guides/event-loop-timers-and-nexttick/
https://jsblog.insiderattack.net/event-loop-and-the-big-picture-nodejs-event-loop-part-1-1cb67a182810 (5 article series)
https://github.com/libuv/libuv (also vendored in nodejs/node)
https://github.com/v8/v8 (also vendored in nodejs/node)
More reading on the subject:
https://javabeginnerstutorial.com/node-js/event-loop-and-asynchronous-non-blocking-in-node-js/
https://stackoverflow.com/questions/34824460/why-does-a-while-loop-block-the-event-loop
https://stackoverflow.com/questions/46004290/will-async-await-block-a-thread-node-js
https://stackoverflow.com/questions/51694299/node-js-socket-io-async-and-blocking-event-loop
http://voidcanvas.com/setimmediate-vs-nexttick-vs-settimeout/
http://dtrace.org/blogs/brendan/2012/11/14/dtracing-in-anger/
https://developer.mozilla.org/en-US/docs/Web/JavaScript/EventLoop
https://jakearchibald.com/2015/tasks-microtasks-queues-and-schedules/ - browsers
https://blog.risingstack.com/node-js-at-scale-understanding-node-js-event-loop/
https://humanwhocodes.com/blog/2013/07/09/the-case-for-setimmediate/
